
Accepted 15 March 2021
Available Online 25 March 2021
- DOI
- https://doi.org/10.2991/mathi.k.210318.001
- Keywords
- Copper–Aluminium–Silicon alloy
additive manufacturing
microstructure
intermetallic phase
mechanical properties - Abstract
In this work, Cu–4.9% Al alloy with little Si (the weight percentage is 1.3%) and little Mn (the weight percentage is 0.8%) was deposited by wire arc additive manufacturing. Microstructure and properties of the deposited alloy was investigated. Microstructural characterization was done using optical microscopy, scanning electron microscopy and transmission electron microscopy. Microstructural investigation revealed that aluminum was enriched at the interlayer (i.e. inside the deposited layers), whereas silicon and manganese were found enriched at the border layers (i.e. at the border of the deposited layers). Evaluation of the mechanical properties showed that the deposited sample had good strength and ductility. The addition of silicon effectively improved the hardness and tensile strength properties of the deposited alloy.
- Copyright
- © 2021 The Authors. Published by Atlantis Press B.V.
- Open Access
- This is an open access article distributed under the CC BY-NC 4.0 license (http://creativecommons.org/licenses/by-nc/4.0/).
1. INTRODUCTION
Wire Arc Additive Manufacturing (WAAM) is a new manufacturing technology with which metallic structures can be created by depositing successive layers along a pre-designed route [1–7]. It provides high deposition and material utilization rate, saves lead time and costs [8], which are advantageous in manufacturing large-scale metallic components [9–11]. Cu–Al cast alloys have poor casting properties with high tendency for linear shrinkage and are prone to hot cracking. The Cu–Al alloy made by WAAM have no thermal cracking issues [1]. In general, various reports show that alloys prepared via arc additive manufacturing process perform better than cast alloys [1–7]. Cu–Al series alloys have excellent mechanical properties, outstanding wear and corrosion resistance are being widely used in oil pipelines, shipbuilding industries and aerospace applications [12,13].
Research on Cu–Al alloy has found that Al as the solid solution element in Cu–Al can increase the formation of deformation twins and dislocation density during deformation twinning process [14]. Further, it has been found that addition of microalloying elements in Cu–Al alloy can enhance their mechanical properties significantly [3,15]. Several investigations on growth kinetics of intermetallic compounds such as, CuAl2, Cu9Al4, Cu3Al in Cu–Al cast alloys have been reported [16–19]. However, at present, no report is available on detailed microstructural analysis such as, distribution of microalloying elements and formation of intermetallic phases in Cu–Al alloy fabricated by WAAM process.
In light of the above-mentioned issues, in this work, Cu–Al alloy was deposited by dual WAAM. The aims of the work were (i) to deposit sound samples by standardizing the process parameters, (ii) to investigate the microstructure, namely, alloy element distribution and formation of intermetallic phases in interlayer (i.e. inside the deposited layers) and at border layers (i.e. at the boundaries of the deposited layers) and (iii) to identify the effect of microstructure on hardness and tensile strength properties of the Cu–Al alloy.
2. EXPERIMENTAL PROCEDURES
The deposition of Cu–Al alloy was performed by using an Advanced 4000R NC controlled CMT welding machine with a WPC-600 multi-function Argon arc welding wire feeder machine. The WAAM process setup is shown in Figure 1. SAFRA CuSi3 (FRO, Italy) wire with diameter of 1.2 mm and the pure Al wire with diameter of 1.2 mm were used to deposit Cu–4.9% Al alloy. The concentration of the elements in the deposited pool was controlled by adjusting the feed rate of pure Al wire and SAFRA-CuSi3 wire at the same time. For example, the concentration of aluminum in the deposited metal can be estimated using the formula given in Equation (1). A pure copper plate was used as the substrate with the size of 100 × 50 × 3 mm3. The chemical composition of the wires is given in Table 1.
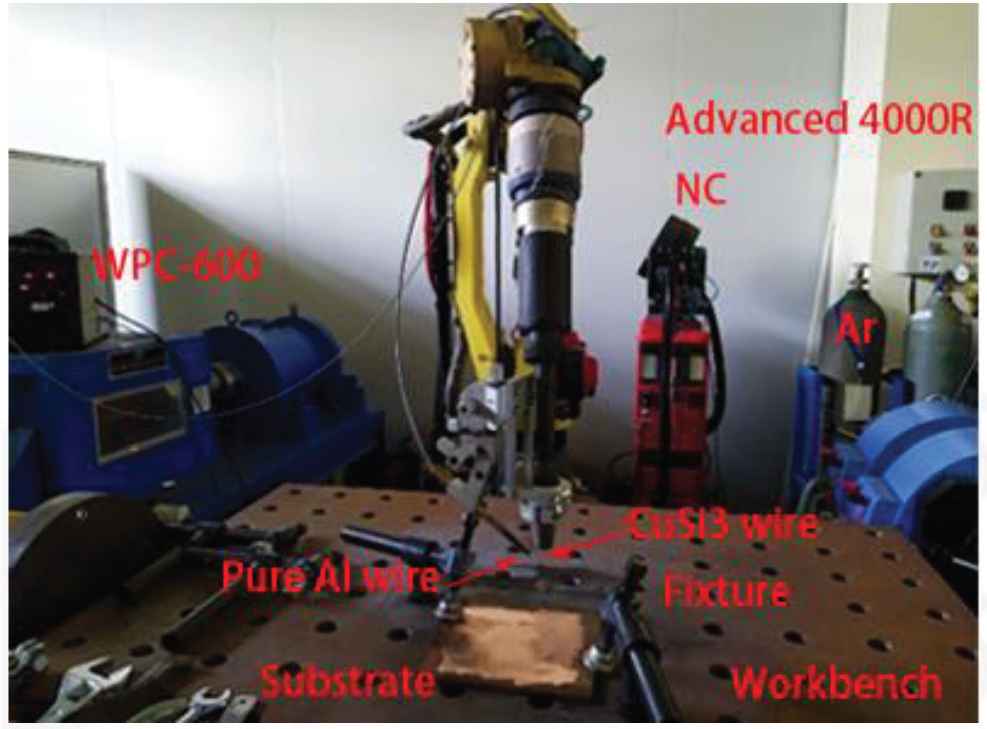
WAAM setup.
| Elements | Sn | Mn | Si | Zn | Cu |
|---|---|---|---|---|---|
| SAFRA CuSi3 | 0.1 | ≤1.0 | 3.0 | 0.1 | bal. |
Composition of wires (wt. %)
After many trials, it was found that height of the deposited sample varied greatly made by one-way production. To deposit the alloy, the round-trip processing method was used instead of the one-way processing method, i.e. the CMT welding head was used in the round-trip configuration to deposit the samples. The round-trip processing method ensures that the thickness of each deposited layer is the same. In this way, it is possible to avoid different heights at different locations on the sample. Figure 2a is the deposited sample after cutting. It is evident from Figure 2a that overall height of the sample is relatively uniform. Deposition parameters are listed in Table 2. Samples were cut from the deposited alloy for microstructural analyses and mechanical properties testing, as shown in Figure 2b.
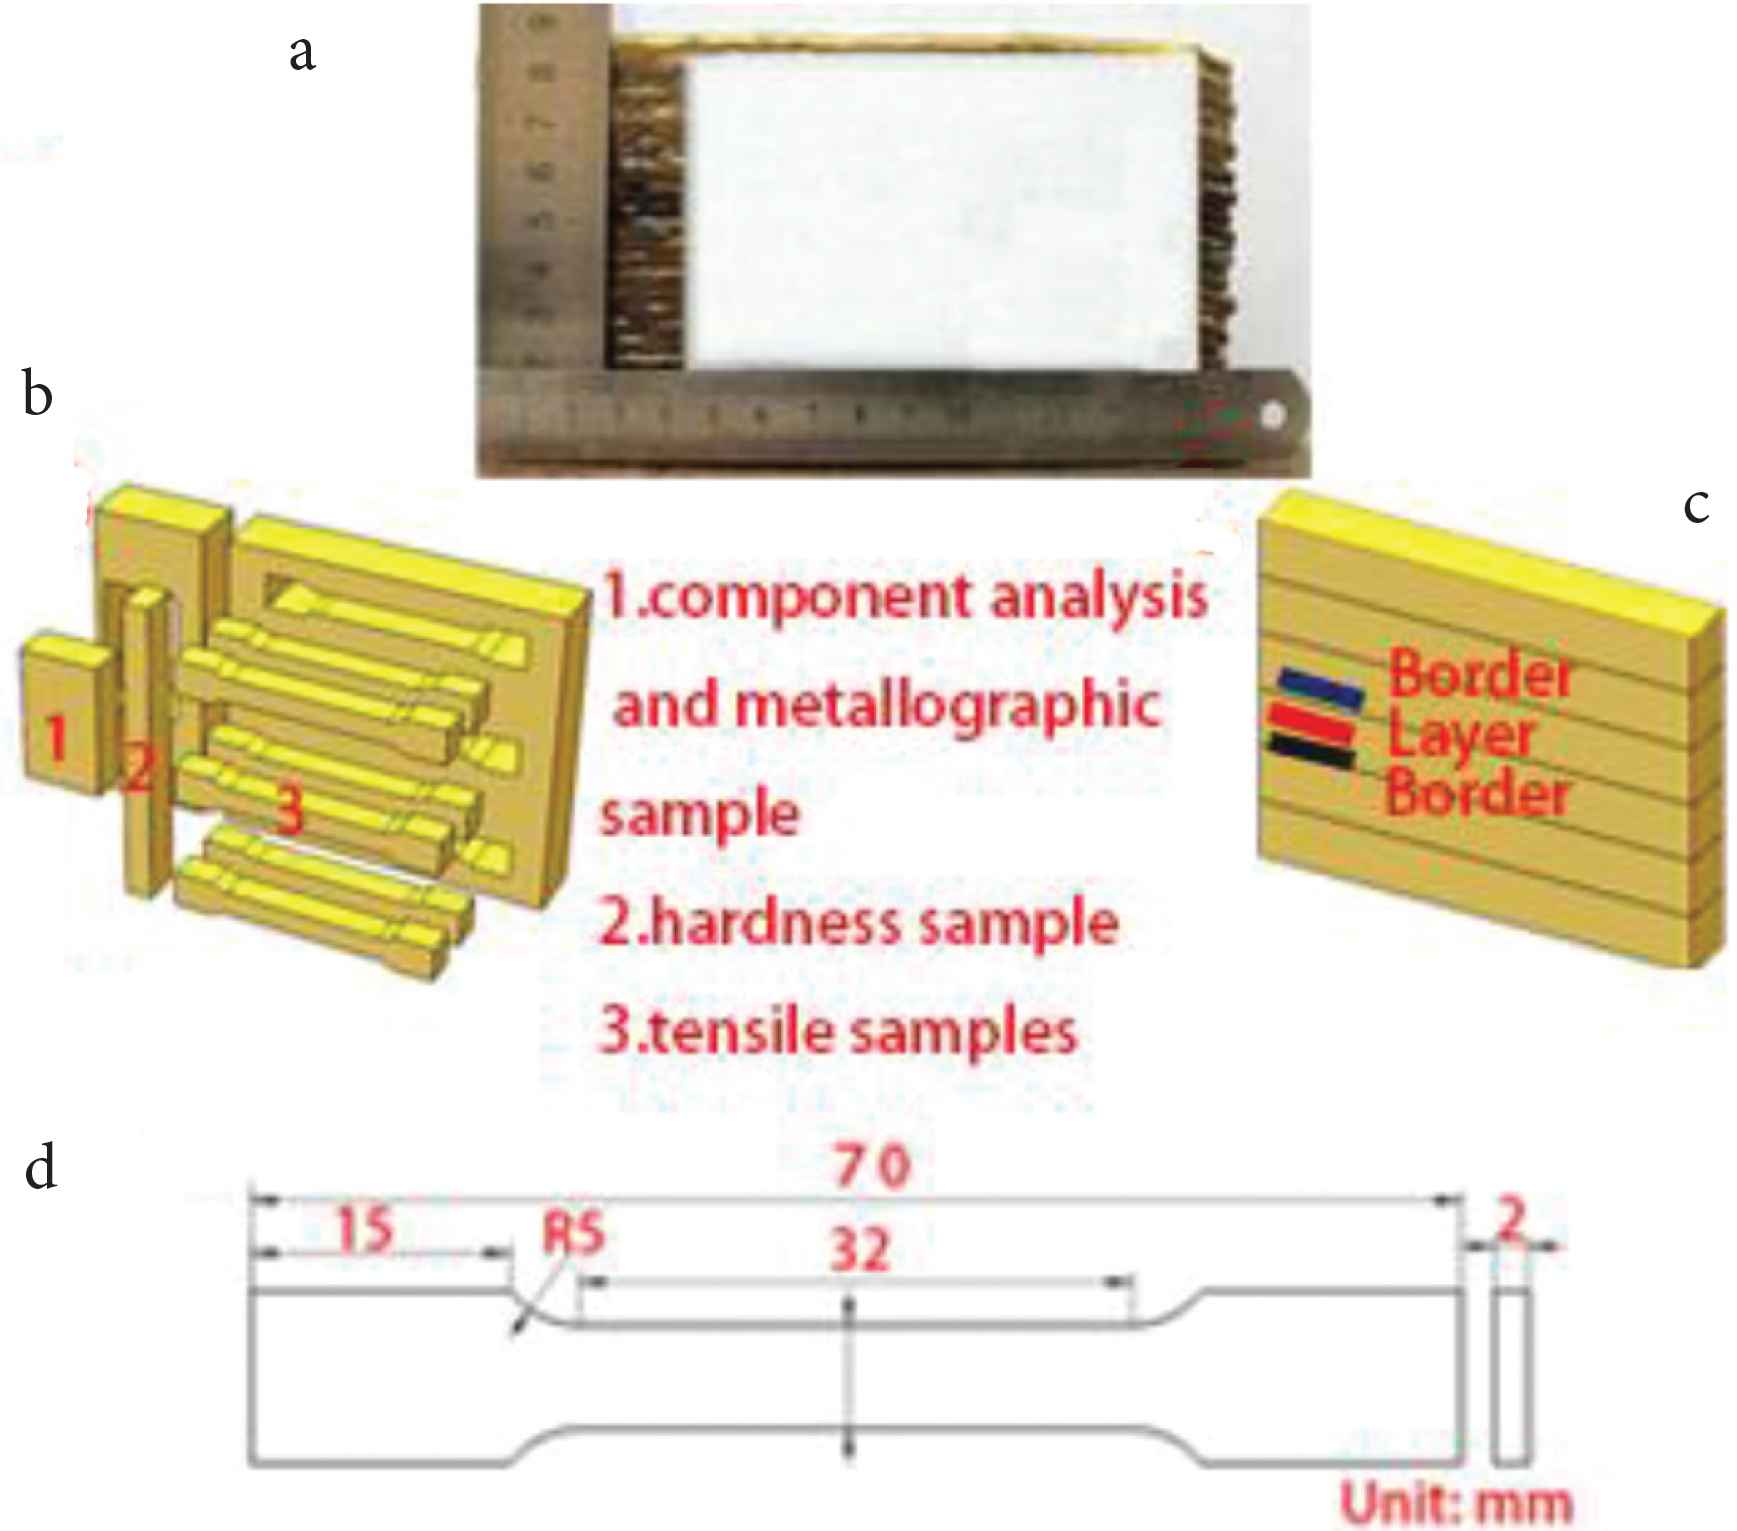
(a) The as-fabricated sample, (b) sampling location diagram, (c) the TEM sample, (d) the size of the tensile sample.
| Parameter | Value | Unit |
|---|---|---|
| Deposition current | 98 | A |
| Deposition voltage | 10.4 | V |
| SAFRA CuSi3 speed | 8.5 | m/min |
| Pure Al wire speed | 1 | m/min |
| Travel speed | 0.35 | m/min |
| Pure argon | 20 | L/min |
| Dwell time between deposition layers | 30 | s |
| Angle between the torch and filler wire | 50 | ° |
| Distance between the torch and workpiece | 18 | mm |
| Pure copper plate thickness | 3 | mm |
WAAM process parameters
Chemical composition analysis was performed by Energy Dispersive Spectroscopy. The microstructures of the metallographic sample were acquired using metallographic microscopes with digital camera. Metallographic samples were etched using hydrochloric acid and ferric chloride solution. The etchant comprised of 120 ml H2O + 30 ml HCl + 10 g FeCl3. Intermetallic phases were analyzed using a JEOL-2100F-Cryo-Transmission Electron Microscope (TEM). Sample for TEM study was prepared by ion (argon) etching (Ion Slicer EM-09100IS installation). Micro-hardness of the deposited alloy was measured at 1.5 mm intervals from the bottom to the top of the metallographic sample, using HXD-1000TM/LCD digital microhardness tester (Shanghai Optics Instrument, Shanghai, China) with test load 4.9N, dwell time 15 s. In the paper the term ‘interlayer’ refers to the region ‘inside the deposited layers’ and the term ‘border layer’ refers to the region ‘at the borders of the deposited layers’, as is shown in the schematic (Figure 2c). A schematic of the tensile test specimen is shown in Figure 2d.
3. RESULTS AND DISCUSSION
3.1. Element Detection
The results of the elemental composition measured by the scan transmission electron microscope (STEM) in the interlayer and the border layers are given in Figure 3. The main content of the sample is copper, followed by aluminum. Silicon and manganese are present in small quantities. Oxygen, aluminum, silicon, magnesium and copper are detected at the border layer. The border layer has higher concentration of Si and Mn elements when compared to the interlayer. In Cu–Al alloy rich in Cu, aluminum easily forms CuAl2 intermetallic phase with copper [20], and very small amounts of silicon and manganese will form other intermetallic phases. As the concentration of aluminum in the Cu–Al alloy increases, a concentration difference will occur, and the Cu–Al intermetallic phase will reverse diffuse into the formed copper solid solution [1]. But as the concentration of copper in solid solution increases, and when the concentration reaches a certain level, Cu–Al intermetallic phase will no longer diffuse inwards after they diffuse into the copper solid solution. While a small number of elements such as silicon, magnesium and oxygen due to the low concentration, which are not occurred back diffuse to the copper solid solution. As the concentration of copper solid solution continues to increase, they will accelerate diffusion into the outside of the copper solid solution. When they encounter oxygen or other elements, they will form a compound, which will stop when the diffusion reaches a certain distance. So that the alloy layer is rich in aluminum atoms, and silicon and oxygen elements will accumulate in the border layer.
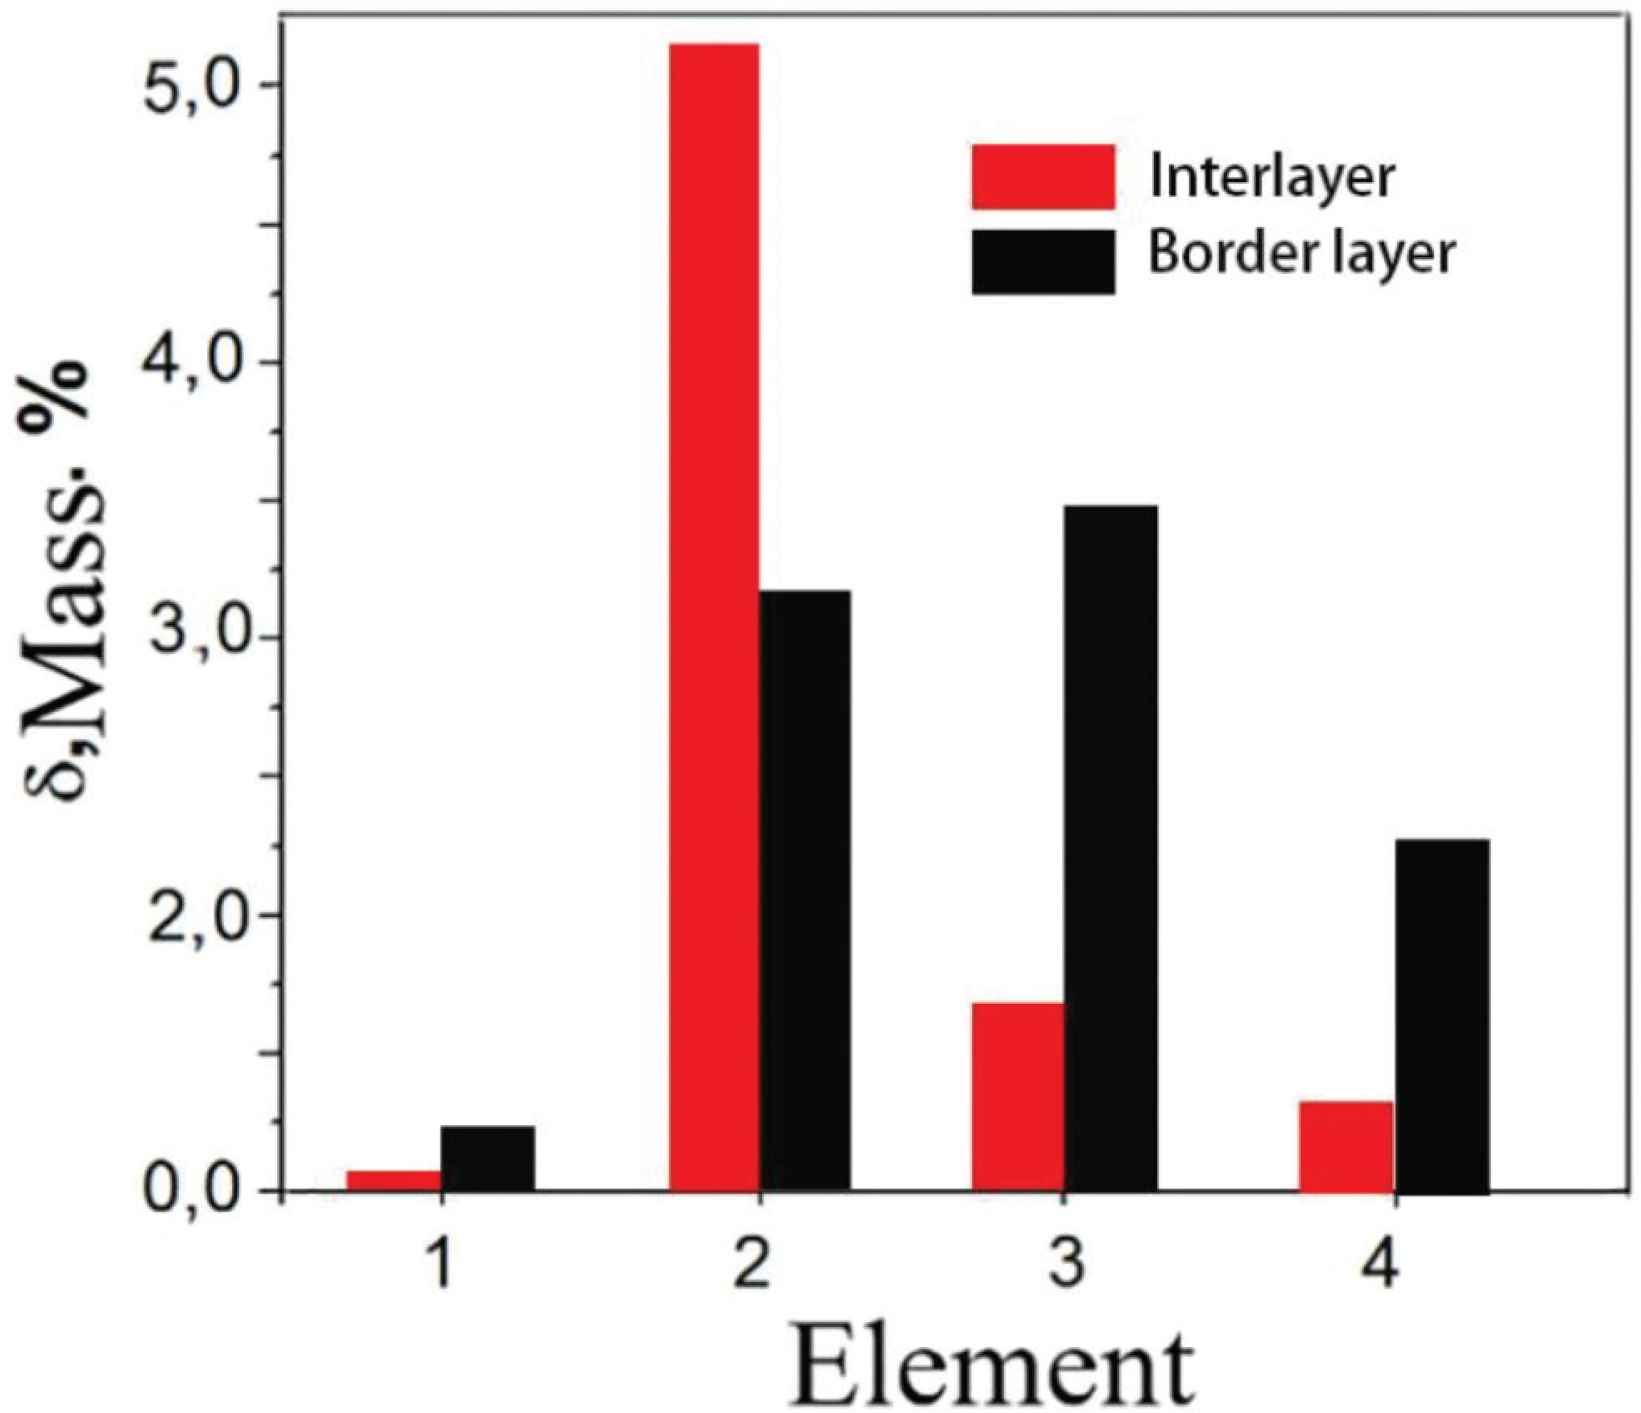
Elemental composition of the TEM sample: 1 – oxygen, 2 – aluminum, 3 – silicon, 4 – manganese, the rest is copper.
Elemental analysis was conducted at spots with a 3-mm interval between spots, along the height of the sample starting from the bottom, to estimate the amounts of Al, Si and Mn. The test results are shown in Figure 4. The Al, Si and Mn contents slightly from the bottom to the top of the deposited sample. The mean values for Al, Si and Mn content are 5.1%, 1.1% and 0.6%, respectively, which are near to the design value 4.9%, 1.3% and 0.8%.
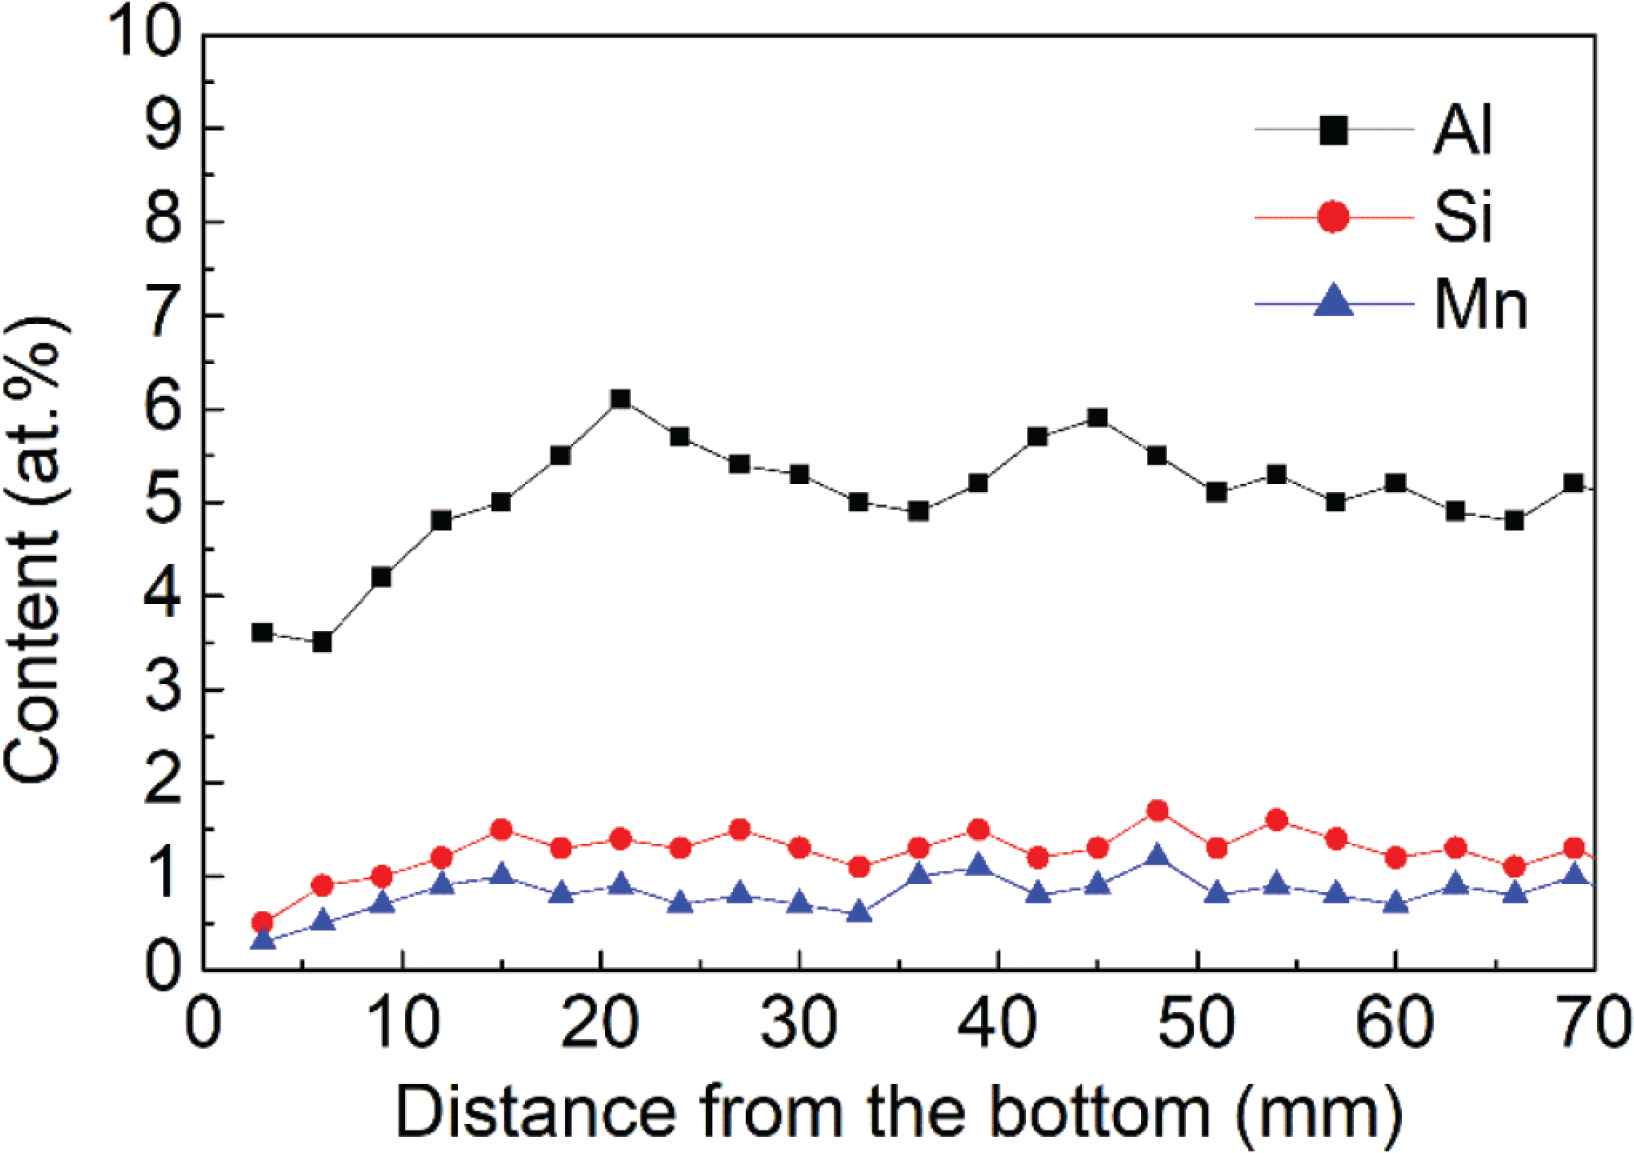
Al, Si and Mn content along the height of the deposited alloy.
3.2. Metallographic Structure of the Sample
The results of elemental analysis of the TEM sample showed (i) the main constituent element to be copper, (ii) small amount of aluminum and (iii) significantly less content of silicon and manganese. In the deposited alloy, the elements are not uniformly distributed: (i) interlayer is enriched with aluminum atoms and (ii) border layers are enriched with atoms of silicon and manganese. From the metallographic diagram (Figure 5b), a border between layers can be seen. At the border region, large columnar grains can be seen, while in the interlayer region fine columnar grains are observed. The variation in the grain size between the two regions is mainly due to temperature gradient and element distribution. The driving force for the columnar grain growth comes from the temperature gradient during the deposition of each layer. When compared to the interlayer, heat dissipation is faster at the border layers, resulting in a large temperature gradient and the driving force for the grain growth. Since the Al element is more distributed at interlayer and less at the border regions, the α (Cu) phase is more at interlayer than in the border layers. At the border layers region, some spots are seen (shown by the arrows in Figure 5a) more distributed in large grains, while within the layer, fewer such black spots are seen. These black spots may be silicon compounds. Inside the layer region, i.e. in the interlayer there are small clumps (as shown in Figure 5c), which could be aluminum compounds.
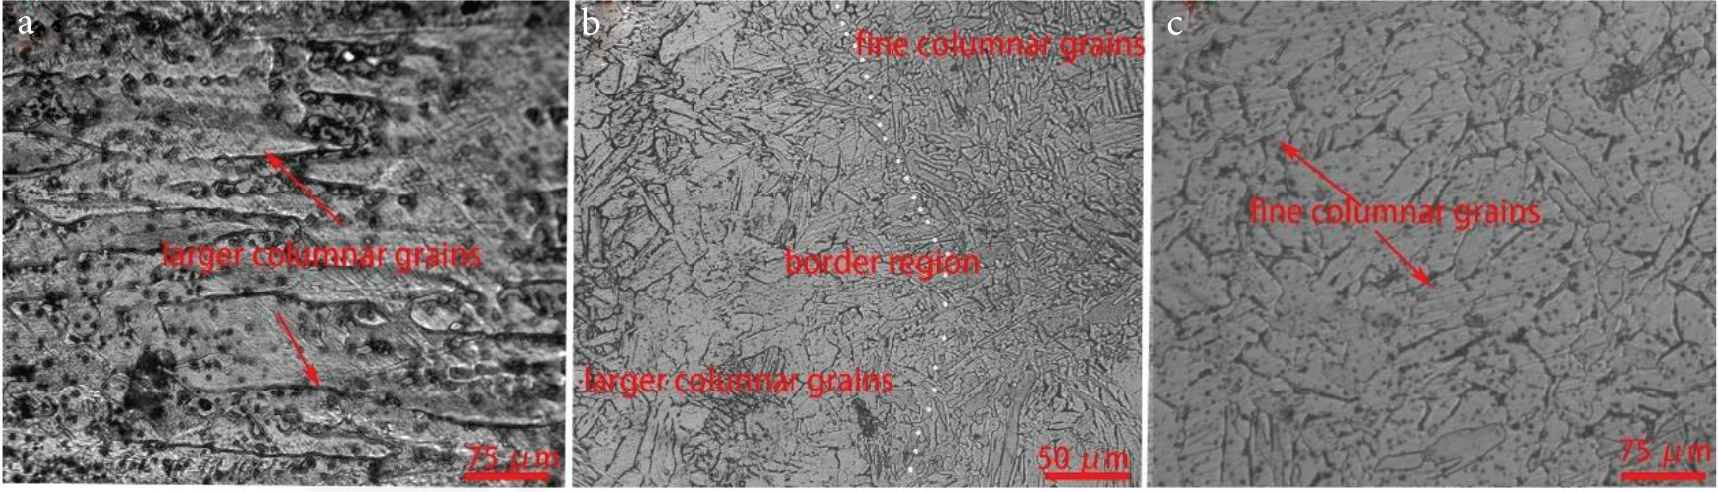
Microstructures of the deposited alloy.
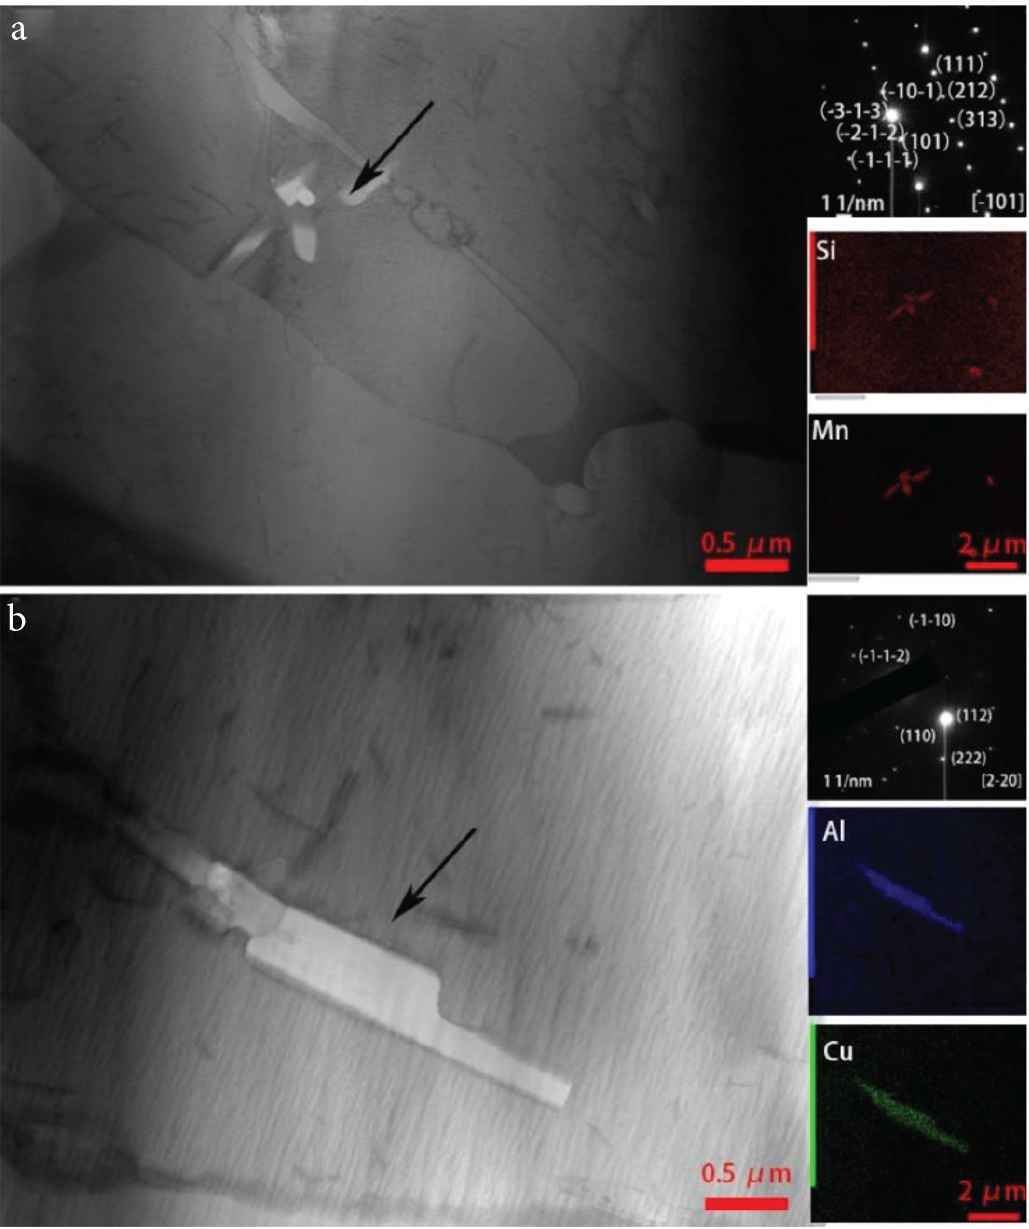
Regions in the border layer and interlayer were further analyzed using TEM (Figure 6). In the border region, a cluster of white areas (petal-like appearance) inside large columnar grains can be seen. Some granular material is also seen distributed at the grain border (marked by circles in Figure 6). The petal-like white areas and the granular material were found to be second phase particles (formed during the deposition of the Cu–Al alloy), by using X-ray micro-spectral analysis (these second phase particles are also seen in Figure 7). Figure 7a shows the result of X-ray microanalysis of the second phase particles. They mainly contain manganese and silicon. The microelectron diffraction pattern of reflections belonging to the same crystalline plane indicates that the second phase particles are a single crystal. Small-angle boundaries and dislocation substructure are not seen in the second phase particles. Microelectron diffraction pattern shows that the second phase particle is the Mn5Si2 intermetallic phase. Figure 7b shows the result of X-ray microanalysis of a second phase particle in the interlayer region. The second phase particle mainly contains copper and aluminum. In the Cu–Al alloy, aluminum and copper easily form intermetallic instead of solid solution before they diffuse into the welding pool [21]. Results of the microelectron diffraction pattern obtained for the second phase particle shows that it is the CuAl2 intermetallic phase.
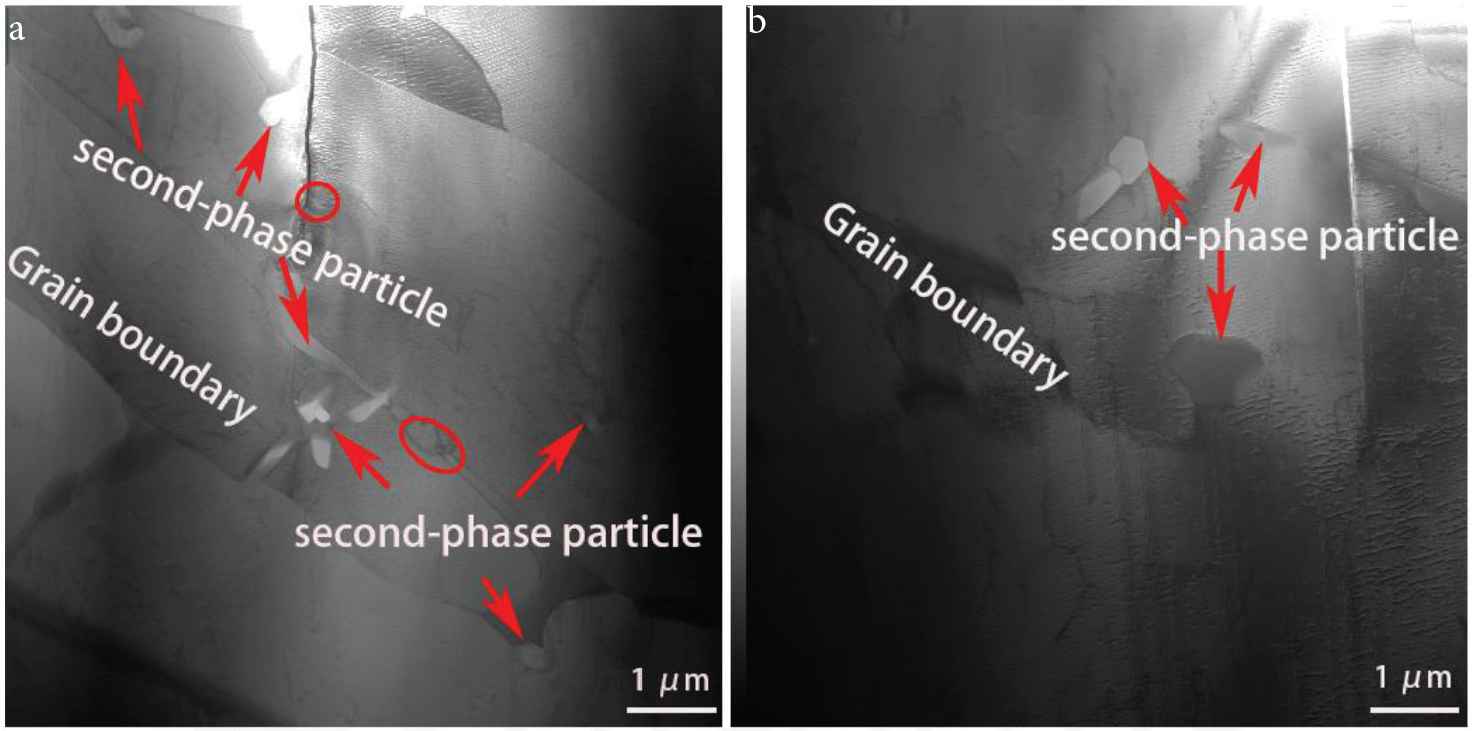
Transmission electron microscopic images of the microstructure in the (a) border layer region and (b) interlayer region of the TEM sample.
Transmission electron microscopic images of the second-phase particles in the (a) border layer region and (b) at the interlayer region.
3.3. Hardness Tests
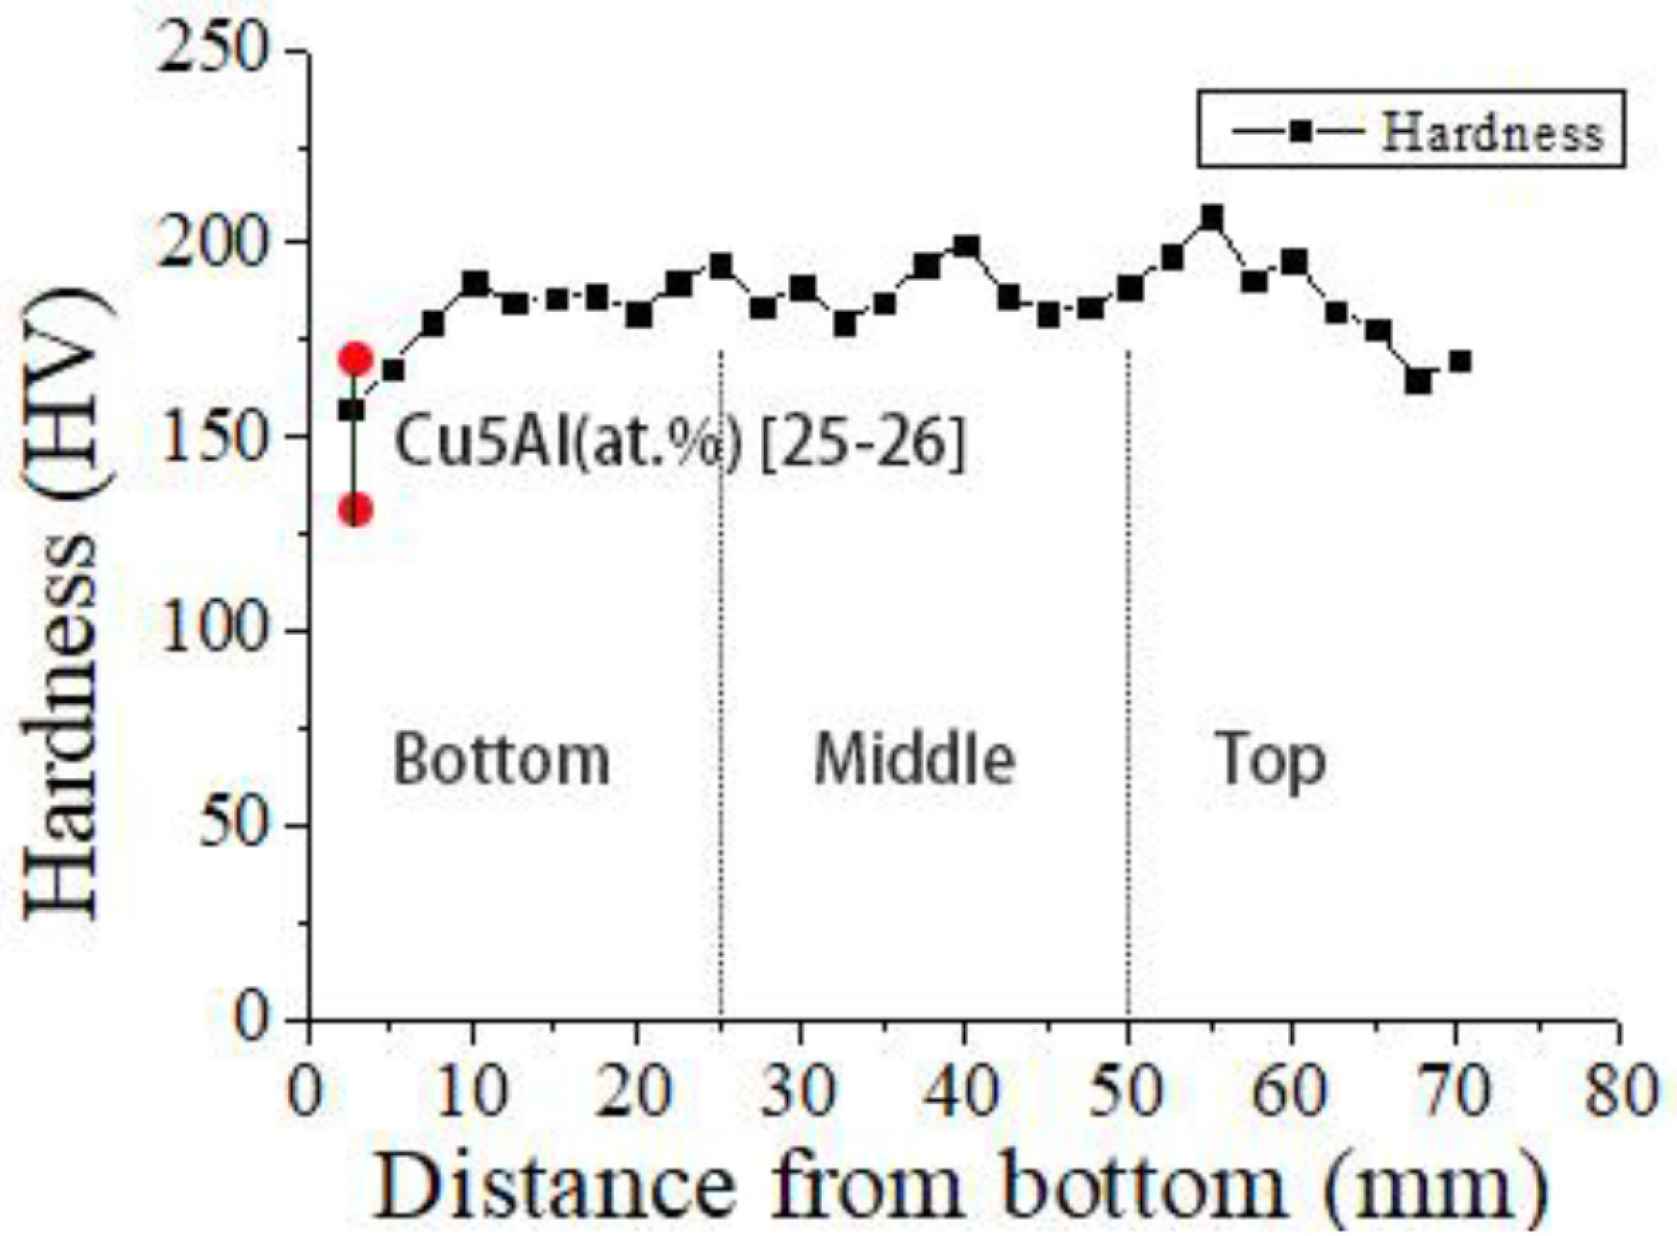
The measured microhardness values of the deposited alloy with increasing height from the bottom of the deposited sample are shown in Figure 8. The hardness measured along the build direction ranges from 158 ± 5 to 207 ± 5 Hv. The average hardness values of the lower region, middle region and upper region are 180 ± 5, 200 ± 5 and 187 ± 5 Hv, respectively. The hardness value in the lower region is the lowest. The hardness value in the middle region is the highest. The hardness value in the middle region is slightly lower than that in the middle region. The lower hardness value in the lower region may be due to the difficulty to open the adequate size of molten pool in the first two deposited layers. As a result, the alloy composition becomes non-uniform, and intermetallic compounds do not form. When a new layer is deposited, the previous layer gets re-melted and other layers will undergo reheating and causes a secondary solid phase transformation which is conducive to alloy homogenization and promotes formation of intermetallic phases such as CuAl2 and Cu9Al4 [21,22]. By comparing the hardness of Cu–5% Al alloys (133–172 Hv [23,24], as is shown in Figure 8), it can be found that the hardness of Cu–Al alloy containing a small amount of silicon (2.2%) is significantly higher. The addition of silicon to the Cu–Al alloy increases the hardness of the alloy due to the formation and presence of Mn5Si2 intermetallic phase.
3.4. Tensile Tests
The average Ultimate Tensile Strength (UTS), 0.2% offset Yield Strength (0.2% YS) and Elongation (EL) values of the samples tested in the horizontal direction (Figure 1c) are given in Figure 9. Results are shown for the tensile samples taken from the bottom, middle and top regions of the deposited alloy. The test results of samples taken from different regions show only ~10 MPa difference in UTS, ~6 MPa difference in YS and about ~0.8% difference in elongation. This implies isotropic tensile properties in the deposited alloy along the build direction. In Figure 9, it is found that the tensile and yield strength of the Cu–Al–Si alloy are significantly improved when compared to those of Cu–5% Al alloy [25], while the ductility is reduced. Silicon addition to Cu–Al alloy influences the tensile properties as it promotes the formation of second phase particles. The addition of silicon can also improve the fluidity and promote the homogenization of the alloy [26].
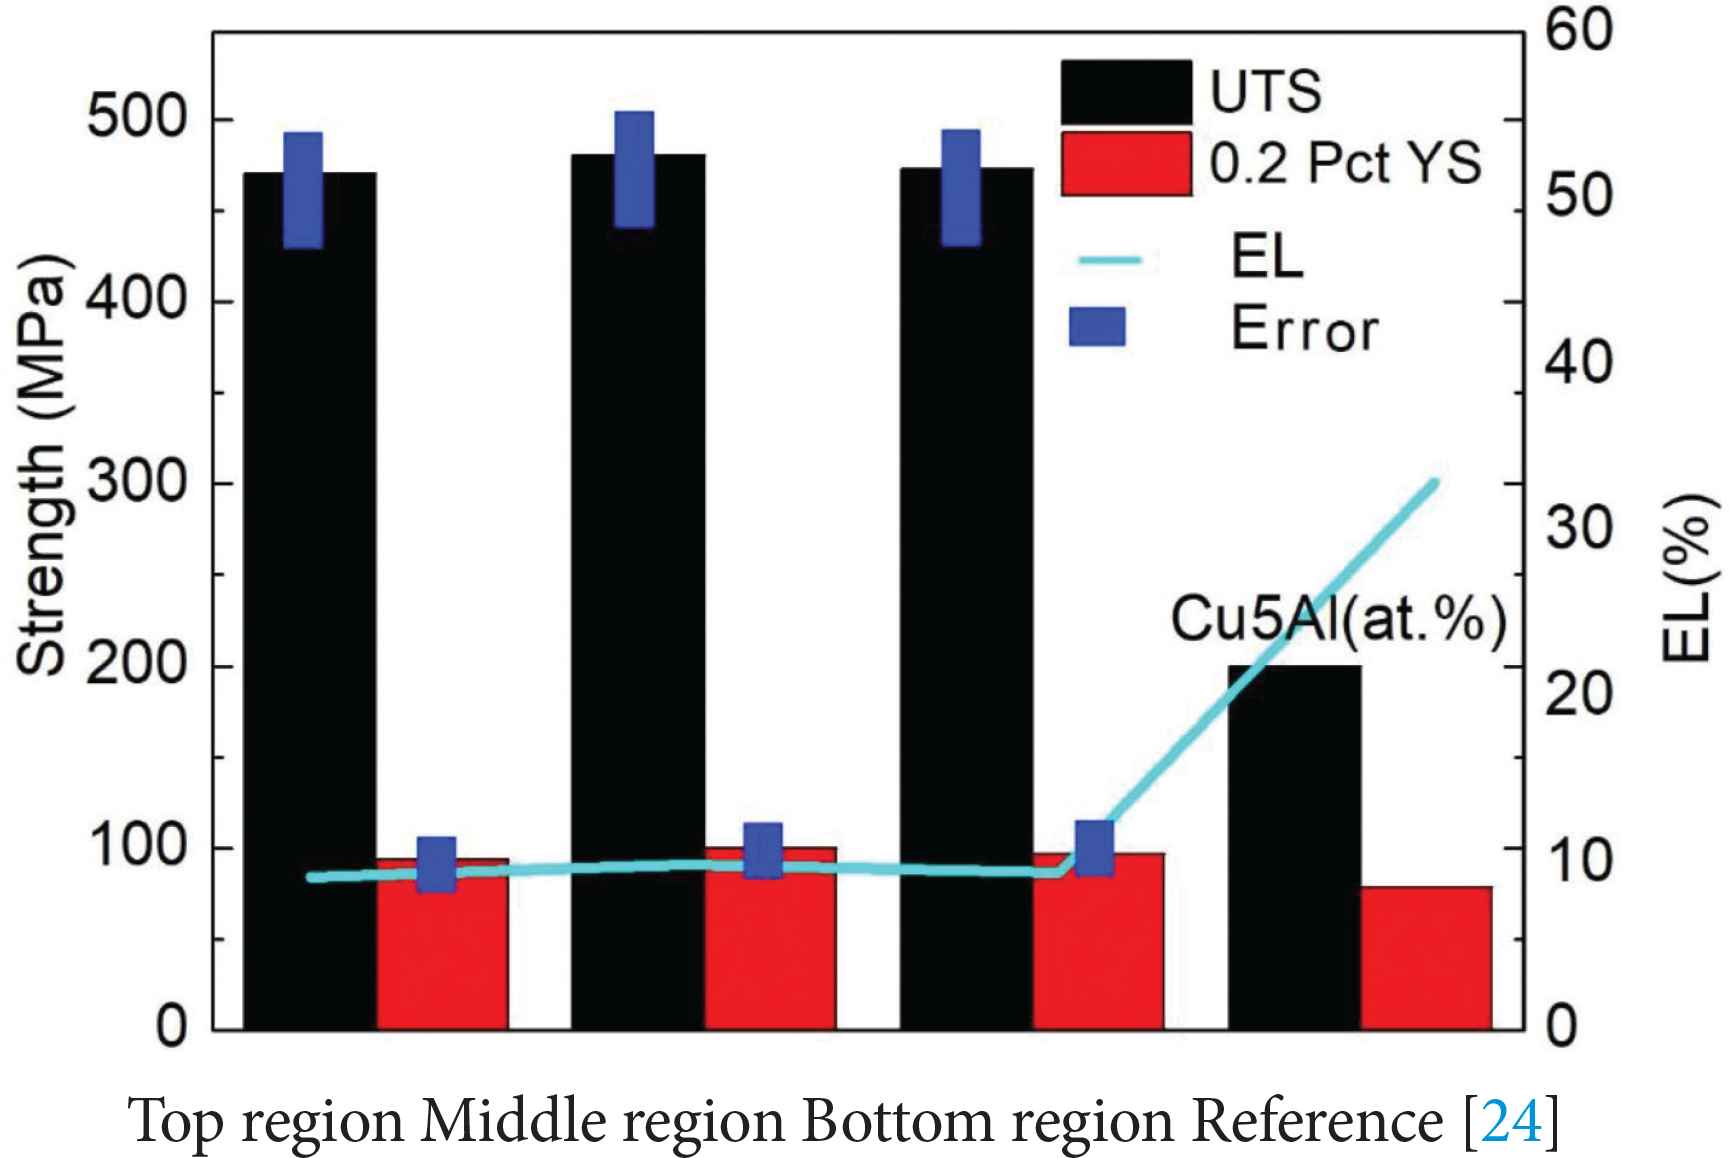
Tensile test results of the samples taken from bottom, middle and top regions of the deposited Cu–Al–Si alloy. Tensile properties of Cu–5% Al alloys which have no silicon [25] are also shown for comparison purpose.
4. CONCLUSION
The microstructure, phase characterization, and mechanical properties of Cu–Al–Si alloy deposited by the twin wire WAAM technique was investigated in this study. The following are the conclusions drawn from the study:
- (1)
The deposited Cu–Al–Si alloy showed enrichment of different constituent elements within the deposited layers and boundaries of the deposited layers. Formation of intermetallic phases, i.e. CuAl2 and Mn5Si2 second phase particles were identified.
- (2)
Silicon addition improved tensile strength and yield strength also improved hardness due to due to the formation of second phase particles.
CONFLICTS OF INTEREST
The authors declare they have no conflicts of interest.
AUTHORS’ CONTRIBUTION
YW is responsible for writing a draft. SK and XC are responsible for writing guidance and experimental guidance. YI is responsible for sample testing. RAS and SJ are responsible for the moisteningness and modification of the paper. XP is responsible for sample production.
ACKNOWLEDGMENTS
This work was sponsored by the National Natural Science Foundation of China under the Grant No. 51975419 and Zhejiang Provincial Natural Science Foundation of China under Grant No. LY20E050027 and Foreign Experts Bureau Project of China under Grant No. QN20200116001.
REFERENCES
Cite This Article
TY  - JOUR
AU  - Yanhu Wang
AU  - Sergey Konovalov
AU  - Xizhang Chen
AU  - Yurii Ivanov
AU  - R. Arvind Singh
AU  - S. Jayalakshmi
AU  - Xiaoming Pan
PY  - 2021
DA  - 2021/03/25
TI  - Microstructure and Mechanical Properties of Cu–Al Alloy Deposited by Additive Manufacturing
JO  - Materials Highlights
SP  - 46
EP  - 51
VL  - 2
IS  - 3
SN  - 2666-4933
UR  - https://doi.org/10.2991/mathi.k.210318.001
DO  - https://doi.org/10.2991/mathi.k.210318.001
ID  - Wang2021
ER  -


