
 , Carson Wilber, Kaixin Ren
Accepted 11 October 2020
Available Online 24 October 2020
- DOI
- https://doi.org/10.2991/nlpr.d.201013.001
- Keywords
- Sentiment analysis
Natural language processing
Twitter
Tweets
Cosine similarity
Polarization axis
Classification bias
Axis score - Abstract
A new method of approaching sentiment classification is proposed where the likelihood of word embeddings to produce useful information from limited Twitter data is studied. The novelty of this work is in determining how short corpuses (taken from Twitter data) are polarized to multiple axes with respect to a subject, as opposed to using a single positive-negative sentiment axis to classify the text with respect to a subject. The unique methodology of this model focuses on deconstructing a short corpus (microblogging entry from Twitter) into key tokens, identifying the correct axis of the sentiment (the polarization axis) using cosine similarity, and then using this axis to generate polarization values to classify each selection of text into fine-tuned axis values. Results of this study show that a single axis may not be enough to express a sentiment. Various axes will have to be combined for better results. Results were measured in terms of classification accuracy, classification bias, and an axis score.
- Copyright
- © 2020 The Authors. Published by Atlantis Press B.V.
- Open Access
- This is an open access article under the CC BY-NC license (http://creativecommons.org/licenses/by-nc/4.0/).
1. INTRODUCTION
Online social networking sites and tools have become popular as well as major communication tools. Users post their ideas and opinions on social networking sites, and the massive data resulting from these online interactions can be used for sentiment analysis (SA) and data mining. Popular online social networking platforms include Facebook, Twitter, LinkedIn, Instagram, Tumblr, Pinterest, and many other microblogging platforms. Twitter is one of the most popular microblogging platforms. It allows users to update messages of up to 280 characters (after increasing its limit in late 2017). These messages are called a “tweet.” Twitter is described as an Internet short message service (SMS) which covers global news, entertainment, and reviews as well as subsets of users who band together in microcosms of larger cultural movements. Nonregistered users of the website can read content from Twitter publicly; registered users can use Twitter or traditional SMS to publish their own tweets. As of 2018, Twitter has a total of 336 million active users, and these users combined send approximately 340 million tweets in a single day. This paper focuses on Twitter as a social tool and tweets as a vehicle of natural language content to perform SA.
Unlike other social platforms, the behind-the-scenes and data created on Twitter is open to almost every Twitter user. This is because it provides convenient, semi-restricted APIs that allow developers to query the service for data on tweets, users, and trends. Using APIs, specific remarks can be collected. In this work, SA is conducted on original content tweets published within a specific time period that express a politically charged opinion regarding the impeachment proceedings. SA is, in general, an attempt to quantify the emotional expression of a selection of texts onto an axis of positive to negative connotation, producing a continuous value of how polarized the text is. The concept of positive and negative connotation is standard in English as in many languages, and determining connotation and sentiment of a text is useful for natural language processing (NLP) to better analyze the abstract meaning of human expression in language.
However, the concept of a positive-negative sentiment axis does not always provide enough information on the text being analyzed. As is the case with tweets, especially with what would be considered a short text of 280 characters, there are limited words with which to express a connotation or sentiment in a traditional sense. So, unlike traditional static methods with preassigned positive-negative sentiment values for each word, Word2Vec enables a dynamic approach to SA by determining an appropriate “axis” on the subject of analysis for which the limited corpus expresses the most meaning with relevant words. This approach of “polarization” of the axis over the sentiment is being proposed as a more representative basis of analyzing abstract meaning of human expression in language.
The novelty of this work is in determining how short corpuses are polarized to various axes with respect to a subject, as opposed to using a simple single positive-negative sentiment axis to classify the text with respect to a subject. The unique methodology of this model focuses on deconstructing a short corpus (microblogging entry from Twitter) into key tokens, identifying the correct axis of the sentiment (the polarization axis) in the specific context of the corpus by using the key tokens, using this axis to generate polarization values, and finally classifying each selection of text into fine-tuned axis values. The polarization of each token is determined by the cosine similarity (CS) of the Word2Vec embedding of the vector from the midpoint of the axis to the word and the axis itself.
Specifically, this study uses a large corpus of tweets collected from November 3 to 13, 2019, focused on the subject of the impeachment investigation in the United States. These tweets were processed by removing duplicates, hashtags, emoticons and emojis, and user mentions, in addition to other standard English contractions (e.g., “can't”). The tokens are then transformed to word embeddings (WEs) using the Google News trained Word2Vec model. A variety of axes are identified for classifying sentiment on a continuous scale.
The rest of the paper is organized as follows: Section 2 presents the background for this work; Section 3 presents the related works; Section 4 presents the data; Section 5 presents the experimental design; Section 6 presents the results and discussion; Section 7 presents the conclusion, and Section 8 presents future opportunities related to this work.
2. BACKGROUND
Due to the nature of social media communications on platforms like Twitter, where common conventions of the English language are not used, or there is the introduction of a form of communication that is not conveyed in words (i.e., rich media such as images and videos, emoticons, and emojis), multiple methods are employed in the preprocessing and translation of text corpuses into datasets for machine learning applications. However, applying these preprocessing methods may alter the original meaning of a post, since the use of emoticons and emojis, for example, could conflict with the goal of SA where the goal is to determine positivity or negativity of a post.
To appropriately consider and address these issues, first various NLP applications and their goals are briefly described and then the preprocessing methods that can be applied to each method are presented.
2.1. NLP Applications
The preprocessing and translation methods to be applied to a corpus depend upon the application being built, and the format of data desired for the application input. In order to identify the preprocessing and translations, the seven classes of NLP applications and their goals have to be well understood:
-
Sentiment Analysis. In SA, an input corpus is analyzed to determine a sentiment on some finite continuous scale. For example, the corpus may be analyzed and assessed as to whether or not the text conveys a positive message (on the +ve scale) or negative message (on the -ve scale.) The end goal is to take any previously unseen input and determine an accurate measure of sentiment for that input. This is a generally a supervised application.
-
Text Prediction (TP). In TP, the input corpus is interpreted and then an attempt is made to produce the terms that would follow an incomplete input message. For example, if the input were “I like to watch the rain ____,” where the underscore represents the incomplete end to the message, the model should predict “fall” or “drip,” or another appropriate word, to complete the message.
-
Analogy Completion (AC). In AC, for example, the input of three words representing three of four terms in a pair of analogies is taken. If the input was “kitten” is to “cat” as “puppy” is to ____, where the underscore represents the prediction the model will make, the model should predict “dog” to complete the analogy.
-
Text Classification (TC). In TC, an input corpus such as a document or other stream of text is used to attempt to identify the input as belonging to one or more classes of information. For example, if the goal of the model is to classify job postings into one of thirty industries, it might take an input describing a cybersecurity technician position as belonging to the “Information Technology” industry.
-
Document Summarization (DS). In DS, a large input corpus is used to interpret the meaning, and produce a much smaller output corpus which attempts to accurately summarize the original corpus. For example, many DS applications are designed to read research papers and produce an accurate abstract or summary for readers to skim or use to understand the relevance and usefulness of a paper to their research.
-
Machine Translation (MT). In MT, a stream of input corpus is used to interpret the meaning, style, and form of speech, and attempt to produce a translation to another language or representation. For example, many MT applications are designed to translate an input stream from one language to another, like English to Russian.
-
Question Answering (QA). In QA, a short input corpus is taken for asking a directed question, analyzing the meaning and intended response, and attempting to produce a suitable answer to the question posed. For example, if asked “Where can you buy groceries?,” the model should reply with “The grocery store” or something similarly suitable.
2.2. Dataset Translations and Transforms
Multiple translation/transformation methods may generally be used for each of the NLP application types; for an estimate of these, see Table 1. Popular translation and transformation methods are explained below.
-
Word embedding. For WE, an input corpus of tokens is translated by translating each token into a multi-real-valued vector encoding the meaning of the word relative to a selection of words in the English language. In WE, words that convey similar meaning are located relatively close to one another in high-dimensional space; words with the same meaning but opposite connotation may exist on a high-dimensional line representing the scale of sentiment.
The dimensions of meaning in WE are abstract, but methods such as Term Frequency/Inverse Document Frequency (TF-IDF) combined with t-Distributed Stochastic Neighbor Embedding (t-SNE) produce a WE library of a language and then represent it in lower-dimensional space for human-comprehensible coarse interpretation, respectively.
WE representation can be used to compare the meaning of words, and later to translate an input corpus to the average of the embeddings of its terms, producing an approximate encoding of meaning.
-
Binary classification (BC). In BC, the problem presented requires an output that segments an input into two distinct and typically orthogonal classes. BC is perhaps the most simple transformation, as each term or group of terms is classified into one class or another (generally represented ss 0 or 1, with an output on the continuous scale 0~1.)
-
Multi-class classification (MC). When a problem requires an approximate classification of the input into a distribution of probabilities for its class, it falls under the category of MC. In MC, an input, whether supervised, semi-supervised, reinforcement, or other actor-critic training methods are used, is denoted as belonging with certain probabilities to each of the proposed output classes.
For example, taking the classification of job listings from a previous example, the job listing for a cybersecurity technician position may fall under multiple industry categories: “Computer Science,” “Information Technology,” “Information Systems,” “Tech Support.” Each category has its own likelihood of accuracy, and so may be represented in supervised learning or proposed in the output of the model. This job listing may be 0.9 likely to be IT, 0.08 likely to be CS, and 0.02 likely to be IS, but not likely to be Tech Support.
-
One-hot encoding (OH). OH is typically used similarly to MC, but when the desired output is a single class with more orthogonal meaning or representation. OH represents a classification as a 0 in all places of an output vector, with a single 1 in a single space encoding the desired classification.
In the former example, the application may need to strongly delineate job listings into a single industry in order to properly index and return listings upon user searches. In this case, OH would be applied, for example, in supervised learning, to tag an input with a single class identifying its expected industry.
-
Part-of-speech tagging (POST). POST is generally used in NLP applications that intend to perform deeper analysis of meaning of an input corpus, such as in QA and TP. POST transforms each word in the input corpus to its respective part of speech: an adjective, verb, noun, pronoun, stop word/notation, and so on.
POST allows for the preservation of tense, and is typically combined with WE methods when used for QA or TP in order to produce an output consistent with the tense and writing style of the input.
| Goal | Translations/Transforms | Methods |
|---|---|---|
| (Universal methods) | Tokenization | |
| Sentiment analysis | Word embedding | Removal of common/low-value words |
| Binary classification | Normalization of style | |
| Multi-class classification | ||
| Text prediction | Word embedding | Removal of punctuation |
| Part-of-speech tagging | Normalization of style | |
| Analogy completion | One-hot encoding | Removal of punctuation |
| Normalization of style | ||
| Text classification | One-hot encoding | Removal of common/low-value words |
| Word embedding | Removal of punctuation | |
| Multi-class classification | Removal of symbols | |
| Normalization of style | ||
| Normalization of form | ||
| Document summarization | Word embedding | Removal of symbols |
| Normalization of style | ||
| Normalization of form | ||
| Machine translation | Word embedding | Removal of symbols |
| Part-of-speech tagging | Normalization of style | |
| Normalization of form | ||
| Question answering | Word embedding | Removal of symbols |
| One-hot encoding | Normalization of style | |
| Multi-class classification | ||
| Part-of-speech tagging | ||
Goals, translations/transformations, and methods.
Table 1 presents a summary of the goals, translations/transformations, and methods.
2.3. WEs as a Focus
This work focuses on WEs as a method for producing rich sentimental data out of the limited corpora contained in each of the selected tweets. WE was selected since WE captures a broader and deeper semantic meaning in the full scope of language. This representation of meaning is used to determine a singular value for the sentiment that is based on axes of varying meanings rather than a simple barometer of “positive” and “negative.”
2.3.1. The Word2Vec model
WEs represent tokens as many-dimensional vectors of continuous values. The most popular application of WE is the Word2Vec model. The most common experimental dimensions for WEs are between 100 and 1,000 values, and the pretrained Google News Word2Vec model uses 300. For elaboration on the following technical brief of the Word2Vec model, refer to the original paper by Mikolov et al. [1].
There are, in effect, two separate schemes to the Word2Vec model: continuous bag of words (CBOWs) and skip-gram, which essentially perform the reverse of the each other using the same underlying mechanisms. Both models use a context window of words (or tokens) around the current position while progressing word-by-word through a moderate to large corpus (such as a news article.) However, the models then perform a different function in that:
-
CBOW attempts to predict the current word using the surrounding words in the context window; during training, the correct word in the original text will be shifted toward the vector which is at the mean of each column of the vectors in the context by adding a small factor of the differential to the mean to the embedding. As multiple pairings of the same or similar words are encountered, the embedding for that word will gradually move to a location in the vector space which minimizes its distance between all other words or tokens with which it commonly co-occurs.
-
Skip-gram, in contrast, uses the current word to predict the surrounding words in the context window, though in a slightly different way: rather than ascribe a vector to each word or token, the output of a round of skip-gram is instead a matrix of probabilities that each word or token in the vocabulary will occur within the context window of the current word. By adjusting these probabilities using the input corpus, the words are then represented as a description of their context, which in effect produces the same result as CBOW in representing the meaning of the word.
From these descriptions, it is evident, as it is in linguistics and literature, that language is not as straightforward as computer science may wish it to be. For this reason, NLP has historically fallen short of being able to produce human-like, conversational usage of words. Deconstructing an inherently human behavior into a hard science, much like economics or psychology, results in a workable and basic but fundamentally theoretical and inhuman system. In early work with decision trees, and perhaps in the average consumer's daily experience with personal assistants, it is possible to engage with an NLP system with formal and direct language, but such models lack the capability to understand or produce eloquent or indeed new uses of an established language.
Word2Vec is a more abstract approach to understanding and manipulating language that approaches the meaning of words by the context in which they are used by humans, and a complex geometric representation of meaning that when stochastically trained will, over enough training samples, produce a representation of language more akin to the human model. Although emotions and broader social context are still missing even from this approach, relationships between words and concepts are better captured without the fine-tuned construction of a digital concept map by a human architect. The capability of WEs to capture more detailed meaning, including expressions of sentiment or polarity with comparable if not decreased manual and computational effort has induced interest from the social science community in applying WEs for SA tasks [2].
There are additional optimizations such as subsampling and negative sampling used to greatly reduce the time and computational resources needed to produce a fully trained Word2Vec model. Due to the scale of a complete English model, for example—which can contain as few as 10,000 common words or as many as millions when accounting for “common use,” slang, and misspellings—it can become numerically ineffective to adjust the embeddings or probabilities for each and every word in the vocabulary at each step, and so the process has be reduced to only apply to a miniscule sample which is far easier to process.
2.3.2. Word2Vec with small corpuses
WEs show promising results when used with small corpuses. As opposed to the other methods presented previously, embeddings do not require full and complete sentences in order to grasp the meaning of a statement. For example, POST generally requires a sufficiently formal sentence structure in order to accurately comprehend and predict language; if a necessary article is missing, the grammar and implications of the language can vastly diverge from the intended meaning. In fact, WEs, in combination with convolutional neural networks, have shown substantial results in classifying tweets related to elections, including understanding out of vocabulary terminology prevalent in microblogging [3], establishing a baseline for using WEs in this paper.
With this more broad and abstract representation of words, we also stray farther from the hard scientific approach to classifying the sentiment of language as positive or negative. Issues that are discussed on social media—which may not and often do not follow the typical constructs and cadence of formal language—can be interpreted not as invoking positive or negative responses, but more complex emotional reactions based on an axis or axes of language such as “happy” versus “sad,” “stressed” versus “calm,” and so on. The particular choices for axes of sentiment in the context of this paper's subject are described in more depth later.
Hence Word2Vec was selected as the basis for this work for understanding sentiment expressed on microblogging platforms. Topics discussed widely on social media are not as simple as a traditional sentiment approach can classify, and indeed applications of traditional positive versus negative sentiment provide little value. This work opens the possibility to using WEs as a descriptor of the sentiment and axis of polarization.
3. RELATED WORKS
The related works section is divided into works on (i) preprocessing, (ii) quantifying emotional polarization, and finally, (iii) the political content analysis on Twitter.
3.1. Works on Preprocessing
Several works have also been done on preprocessing online texts [4–7]. Saif et al. [5] looked at the effectiveness of removing stop words in the context of Twitter sentiment classification. In this paper they investigated whether removing stop words helps or hampers the effectiveness of Twitter sentiment classification methods. They recommended that the dynamic generation of stopword lists, by removing infrequent items appearing only once in the corpus, appears to be the optimal method to maintaining a high classification performance. Haddi et al. [4] explored the impact of preprocessing methods on Twitter sentiment classification. Bao et al. [7] looked at the effects of URLs, negation, repeated letters, stemming, and lemmatization. Their results show that classification accuracy rises when negation transformations are performed and repeated letter normalization is employed, and descends when stemming and lemmatization are applied.
3.2. Works on Quantifying Emotional Polarization
There are many papers on SA exploring both traditional and machine learning approaches to NLP as they are applicable to quantifying emotional polarization. In tandem with the popularity of social networks, SA has increasingly become an area of interest for many studies.
Akaichi et al. [8] collected some comments from Facebook users during the Tunisian Revolution. Emotional analysis of corpus was performed using machine learning algorithms. The Naive Bayes (NB) and support vector machine (SVM) algorithms were compared by combining different feature extractors. Higher accuracy was obtained by combining different characteristics for SA. They constructed a sentiment lexicon, based on emoticons, interjects, and acronyms.
Gonçalves et al. [9]'s study aims to compare the popular methods to find out the potential limitations, advantages, and disadvantages for SA. The researchers compared eight popular SA methods in terms of accuracy and agreement to classify the sentiment of each input text. Also, they developed a new method that combined existing approaches, providing the highest accuracy and comparative agreement. They use positive or negative to identify polarity.
Vishal and Sonawane [10] gathered and labeled a collection of positive, negative, and neutral tweets. A number of linguistic statistical analyses were performed on the collected corpus. The NB classifier and SVM were used to classify each text. The results show that the NB classifier has a better classification effect. When training the Bayesian classifier, two different approaches were implemented: one of them combined the presence of n-grams and the other combined the part-of-speech distribution information. Their results indicated that the best performance was achieved using bigrams.
Hamid and Islam [11] analyze the collection of tweets in two ways. First by a method of literary analysis to classify the emotion of each tweet using a lexicon-based approach, and second, using a machine learning-based approach. Machine learning methods in NLP include Case-Based Reasoning, Artificial Neural Networks, and SVMs. They measured tweets in terms of positive, negative, and neutral.
Erik and White [12] elaborate on the development of NLP technology, including the historical background of NLP technology and some likely evolutions. A semantic-based NLP method was introduced.
Rajman and Besançon [13] studied the methods, applications, and techniques of text mining. It was demonstrated that data mining technology can extract useful information from text-based databases. According to different sources of information extraction, the authors propose four methods of text mining, which are term-based methods, paragraph-based methods, concept-based methods, and pattern classification methods. Useful results of text mining are explored, including the generation of association rules.
Agarwal et al. [14] uses linguistic features to perform SA on Twitter data. The experiments on Twitter SA showed that part-of-speech features may not be useful for SA in the microblogging domain. More research is needed to determine whether the POS features are just of poor quality due to the results of the tagger or whether POS features are just less useful for SA in this domain. Features from an existing sentiment lexicon were somewhat useful in conjunction with microblogging features, but the microblogging features (i.e., the presence of intensifiers and positive/negative/neutral emoticons and abbreviations) were clearly the most useful.
Luo et al. [15] also looked at a negative or positive opinion about a particular topic. They used social features to improve performance.
3.3. Works on Political Content Analysis on Twitter
Few works have looked at the political analysis of Twitter data. Jungherr [16] provided a comprehensive literature review of 115 studies on Twitter in Politics. Small [17] looked at the Canadian political aspects of Twitter data in relation to the hashtag. Ausserhofer and Maireder [18] looked at the interrelation of individuals on the basis of their professions and their connection to mass media using Austrian political data.
Most of the works presented in this section measure polarity by a single axis of positivity and negativity. Our work attempts to study microblogging corpuses using multiple axes, to better express the sentiment of the political tweets.
4. THE DATA
For this study, the Twitter API was used to collect a total of 150,000 tweets on the subject of impeachment. This totaled 45,342 tweets, accounting for copied tweets (not including re-tweets and replies, which were filtered and removed during collection). The data, collected in the form of a JSON file, comes from tweets generated from November 3 to 13, 2019. Before processing the data, the data was converted into a CSV file, extracting the three columns, at, id, and text, from the original data. Where the text field was abbreviated due to excessive length, alternative columns were pulled from the embedded full tweet object's full text field, which contained the unabridged content of the tweet.
240 tweets were labeled with classes representing the sentiment of guilty (class 1, using the “guilty” embedding) or that he is innocent (class 0, using the “innocent” embedding). Accuracy was compared using this initial classification as well as across other axes of embeddings.
5. EXPERIMENTAL DESIGN
5.1. Preprocessing
SAs of Twitter corpuses will be highly affected by the inherently noisy nature of Twitter data, hence to analyze a corpus of tweets, the first step is preprocessing. Preprocessing involves a series of techniques, presented below, mainly performed to get better results. First general preprocessing methods for Twitter corpuses are presented, and then the preprocessing done on the Twitter dataset used in this paper is presented.
5.1.1. Preprocessing methods for Twitter corpuses
-
Tokenization. In NLP applications, the text corpus is divided into a term for every word, rather than grouping words into phrase terms or analyzing sentences. Tokenization is fundamental to applying any further preprocessing methods or translation to the corpus.
-
Removal of common/low-value words. Common words like articles (a, an, the) and prepositions (in, of, between) provide little value in meaning. In the case of SA, it is useful to remove these words and focus on terms that provide more sentimental meaning.
-
Removal of punctuation. In all cases except perhaps SA, punctuation does not serve a useful purpose. It may manipulate the representation of terms, as most punctuation occurs at the end of a word (like a comma or period). Punctuation may be removed or replaced with a standard PAUSE or STOP character.
-
Removal of symbols. Emoticons, emoji, and pictographs are frequently used in social media posts. In the case of SA, they should often be kept; however, for almost all other NLP methods, they should be removed, as they do not provide value to interpreting the meaning or predicting the future stream of text.
-
Normalization of style. In social media posts, it is common to use nonstandard representations of words or a mix of styles. For example, Capital Case, lower case, ALL CAPS, StUdLy CaPs may be intermixed. For translation, the corpus should be transformed to the same case.
-
Normalization of form. Tense and conjunctions are a part of common parlance and are important to accurately conveying information.
5.1.2. Preprocessing the Twitter data
Before performing word segmentation, initial preprocessing was performed on the CSV file, for example, removing punctuations, numbers and stop words. English words in uppercase were converted into lowercase. Abbreviations and contractions had to be restored. For example, some common contractions had to be resolved: “aren't”: “are not,” “can't”: “cannot,” “couldn't”: “could not,” “didn't”: “did not,” “doesn't”: “does not,” “don't:” “do not.” Expanding these contractions helped in the subsequent segmentation of words.
Stop words are words that appear often but have little meaning. In English, stop words are, for example, “a,” “and,” “is,” “the,” “of,” and so on. For this analysis, text analysis was being performed based on word frequency and statistical methods, and stop words would reduce the accuracy of the analysis, hence were removed.
There were also many punctuation marks, user mentions, multimedia, and links in the original data. These could not be handled by the proposed model, and hence were removed. At the conclusion of preprocessing, only English words that were of sentimental value were left. Future work will return to applying the usefulness of rich non-English sentiment indicators as mentioned in [14] to produce more robust representations of microblogging text such as tweets for analysis as performed in this paper; for simplicity of proposing a novel approach to SA, these tokens were dropped.
Finally, word segmentation was performed. Word segmentation splits the input text into each token separated by a space. The result is the final input. This process is illustrated in Figure 1.
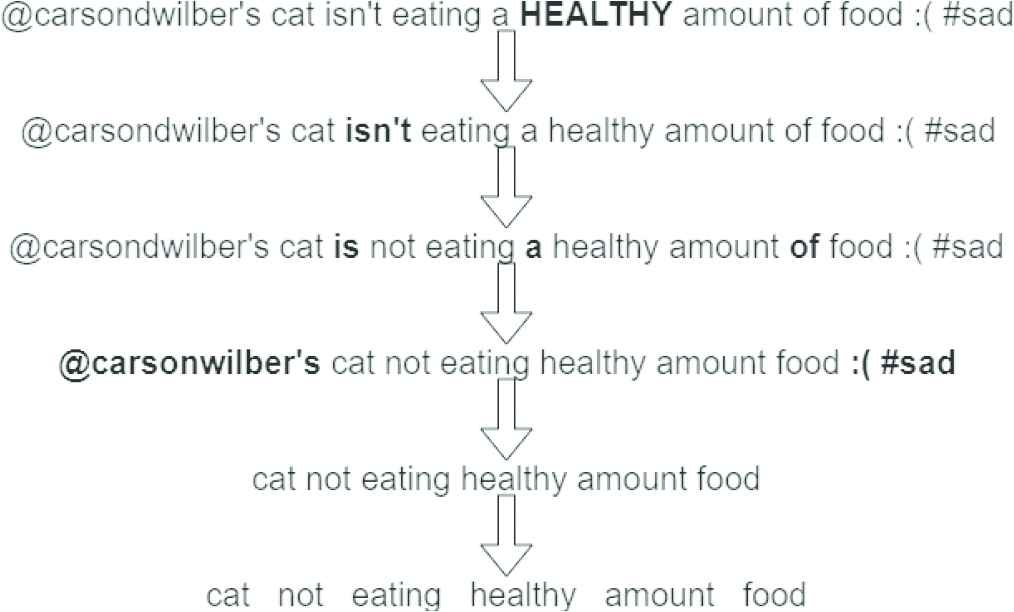
Illustration of preprocessing.
5.2. Calculating Polarization
The proposed method builds off of prior work in WEs, social networks, SA, and linguistics, to efficiently calculate a per-word and per-corpus sentiment value easily fine-tuned to the problem space. To explain the proposed method, first the format is explained, and then the implementation, and value of WEs is presented. WEs are high-dimensional representations of all of the recognized words in a language (sometimes including misspellings, generalized phrases with numbers or percentages, etc.) with values determined as a product of the use of the word in different contexts.
For example, the word “burger” will likely appear frequently in statements about food, that is, “I want a burger.” The “closeness” of the word to the other words in context is used to slowly approximate the “meaning” of the word in high-dimensional space; words further away should be further away from the target word, as they carry different meaning. Ultimately, other “food words” like “smoothie” will tend to appear in similar contexts, and gradually move in high-dimensional space to be relatively close to “burger.” The groups that form are easily recognized by human interpreters, but WE is the most effective method that machine learning models have been able to use to thoroughly and efficiently interpret natural language.
SA, as target of this proposed method, has important applications in the interpretation of natural language [19], particularly on social media. SA broadly means the classification of a corpus into a positive or negative category based on the meaning of the words it contains. For example, “I hate shiny fountain pens” should, with a well-trained model, classify as a negative statement. However, in this particular case, it is also important to note the small corpus, and the minor sentimental value in the other words: the pronoun is unlikely to carry any value, while “fountain pens” may contain a strong positive value as they are typically referenced in positive contexts, for example, “I love shiny fountain pens.” The corpus may, for that reason, be rated neutral or slightly positive, when in fact the primary acting word “hate” should drive the sentiment to negative. The model has associated the sentiment of “fountain pens” out of context, and thus spoiled the overall sentimental meaning.
This problem is exacerbated on microblogging social media platforms like Twitter, where the corpus to classify is typically a small number of words combined with hashtags, emoticons, and emojis references to other users, and typically incorporate multimedia like photos or videos. A short corpus, or one that does not contain as many words as it does other indicators of meaning, are hard for NLP models to classify. The above example is made worse with these datasets where a limited number of words in the corpus carry sentimental value and can accidentally steer the sentiment toward the wrong axis.
In order to combine these two conclusions and create a model that is resistant to misclassification of sentiment and factors in the high-dimensional meaning of words, this proposed generalized model for SA of social media corpora is presented.
5.2.1. Polarization axes
A variety of polarization axes were identified. Words with a meaning and connotation were chosen, taken to be the opposite or complement of each other, and several polarization axes were developed:
A1: Guilty - Innocent
A2: Bad - Good
A3: Negative - Positive
A4: Dislike - Like
A5: Oppose - Support
A6: Liberal - Conservative
A7: Democrat - Republican
A8: Accept - Reject
A9: Happy - Angry
A10: Convict - Acquit
A11: Justice - Patriotism
A12: Satisfied - Unsatisfied
A13: Pleased - Displeased
5.2.2. Cosine similarity
CS is a standard technique used in WE for comparing the similarity of two words, that is, embeddings [20,21]. CS is equivalently the dot product over the product of the magnitudes:
This produces a calculation of the distance between any-dimensional vectors. In most Word2Vec models, including the model used in this paper, this would be vectors with 300 dimensions. Each vector is normalized before calculating the CS, and the result constitutes a measure of “similarity” of the two vectors from −1.0 to 1.0 in how closely the two vectors represent the same direction in their dimensional space, as shown in Figure 2.
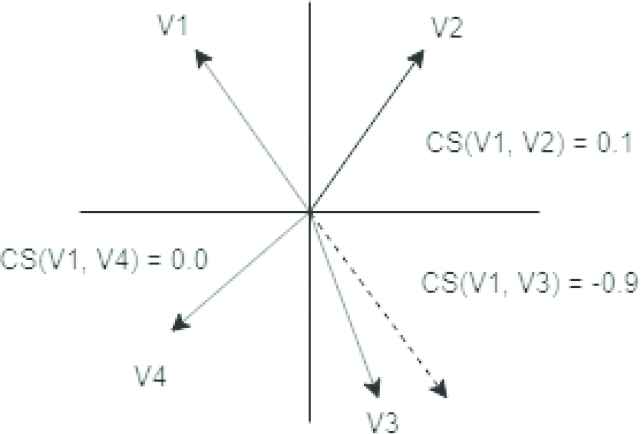
Calculating cosine similarity.
In addition to using CS to determine the polarization value of each individual token, the mean value of each dimension of the embeddings is also taken to be the encoded meaning of the entire selection of text. The absolute value CS of this vector and the polarization axis are then calculated. This value presents the overall distance of the selection to the sentiment axis—agnostic of its True Positive (TP) or True Negative (TN) value—which demonstrates how closely the selection is polarized along the axis. A selection of text which is heavily polarized in either direction indicates that the axis is accurate for the corpus; a selection of text which does not clearly align with the axis may indicate that the axis is not an accurate polarization of the corpus.
The average of this value was taken for each text in the corpus to be a representation of how accurately the selected axis represents the polarization of the corpus, deemed here the axis score (AS). How this value helps in determining the appropriate axis for any given corpus is discussed further in the experimental results. The results may contribute to future work in accurately analyzing the polarization for a subject discussed on social media platforms in general and microblogging platforms in particular. An axis with a higher AS implies that the axis more accurately represents the polarization of the corpus with respect to the subject. The AS is calculated as follows:
Figure 3 demonstrates a chosen axis and a selection of WEs which result in a low overall AS. The absolute value of the CS of V1 is low, indicating its meaning is not closely related to the sentiment captured by the axis and is therefore of little value in determining sentimental value with respect to the axis; the CS of V2 is relatively high, indicating that its meaning is closely related to the sentiment captured by the axis; and V3 is orthogonal to the axis with a CS of 0, indicating it captures an exactly opposite meaning than the axis (which while improbable, serves the purpose of example).
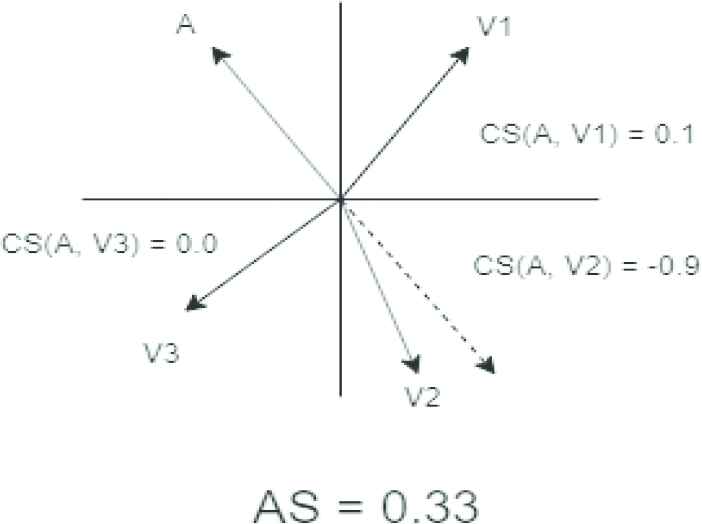
A set of disjoint word or corpus (V1-3) embeddings compared to the axis of sentiment (A) and their associated low cosine similarity (CS) values CS(A, V#).
Figure 4 demonstrates a chosen axis and a selection of WEs which result in a high overall AS. The absolute value of the CS of all three vectors is high but not exact, indicating all three words meaningfully contribute to determining sentimental value with respect to the axis. If a vector were to have an absolute CS of 1, indicating an exact match with the axis, it is almost certain that the word is in fact the same as the word chosen to determine the axis in that direction.
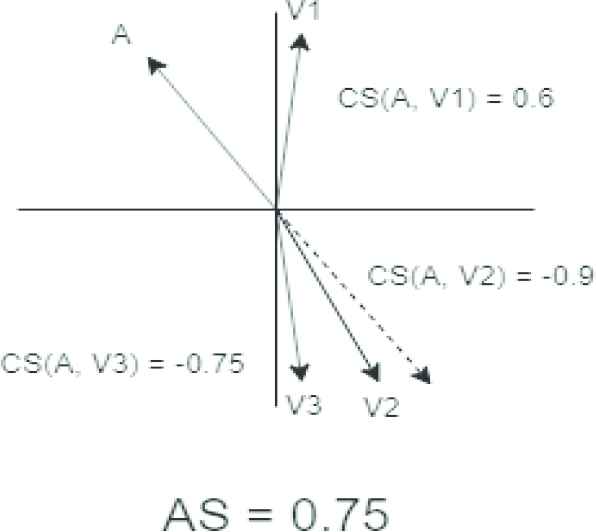
A set of cohesive word or corpus embeddings with high cosine similarity (CS) values.
The mean polarization value of the tokens of each text is taken and compared with the BC of this value against a hand-labeled validation set. An axis with a more evenly distributed truth table—in the case of microblogging platforms, a result which should yield a relatively even likelihood of true or False Positive (FP) or False Negative (FN) classifications—is more likely to be an accurate polarization of the corpus with respect to the subject. A truth table skewed toward positive or negative classification indicates a poorly selected axis where the consensus of polarization on the subject tends toward one side, and thus the true polarization should be more specific or better tuned.
These two approaches are combined to analyze the polarization axis to select the most appropriate axis for the subject.
5.3. Methodology
The proposed method, as applied to this dataset, depicted in Figure 5, is presented next.
Identify the topic of analysis and a word representing the positive and negative sentiment for it.
Example: Impeachment; “guilty” versus “innocent”
Take the high-dimensional vector from the WE of the negative word to the positive word as the axis of polarization using a trained Word2Vec model.
Example: model.embedding[“innocent”] - model.embedding[“guilty”]
Collect corpora to classify and analyze.
Example: Unique tweets containing the word “impeach” from the Twitter API
Perform preprocessing on each corpus as described in the Preprocessing the Data section.
For each input:
Split the input into its individual tokens.
Use the Word2Vec model to translate each token into its WE.
Calculate the CS of each token to the polarization axis to determine its positive or negative polarization value.
Take the mean of the polarization of all tokens in the input as the polarization value of the whole input.
Use a rounding scheme to determine a binary positive or negative classification for the input ascribed to our fine-tuned positive and negative meaning.
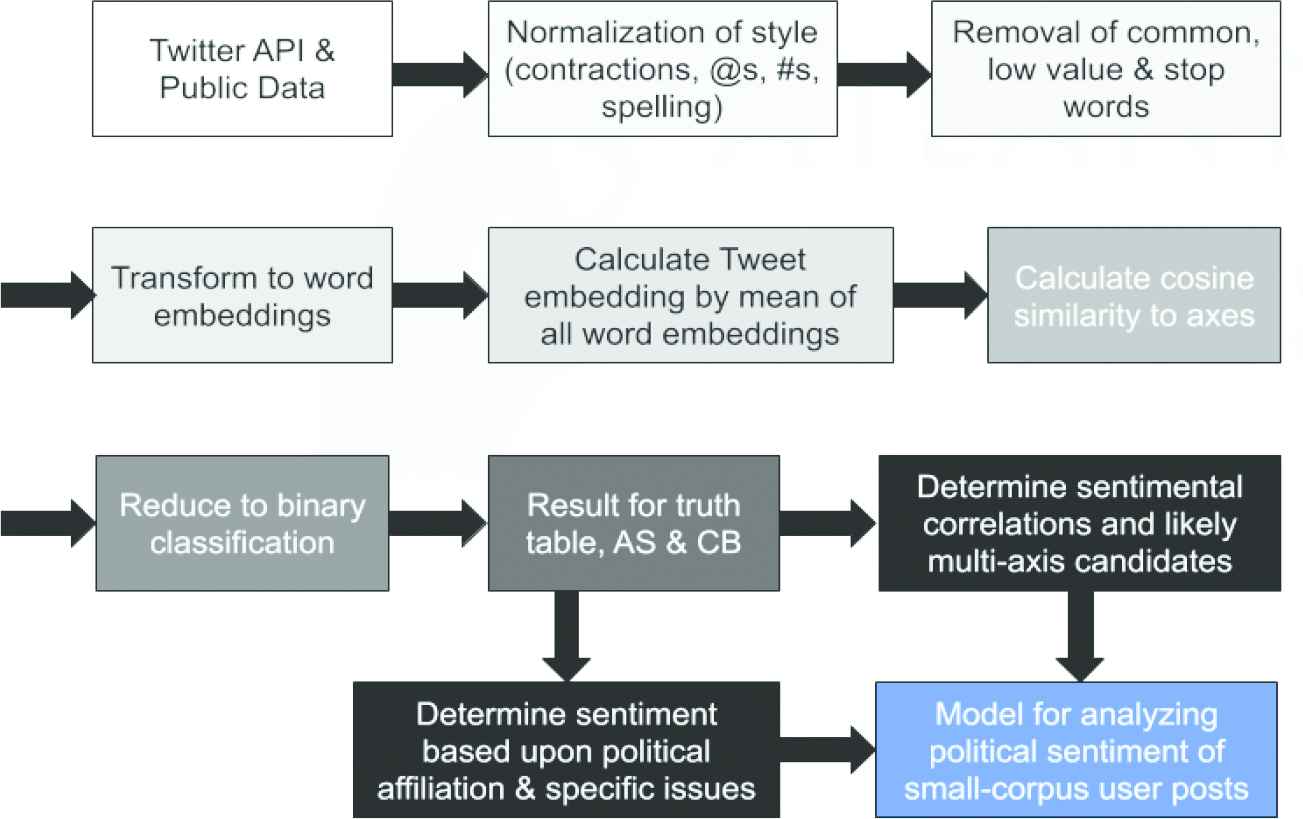
Experimental design.
6. RESULTS AND DISCUSSION
Using the Google News pre-trained Word2Vec model as the basis for WEs and the methodology described, the classification accuracy, truth table, and AS for each axis was determined. The most appropriate axis would be the axis with the highest AS and most evenly distributed truth table. Table 2 presents the truth table, showing the TP, FP, TN, and FN. Classification accuracy, classification bias (CB), and AS are also presented in Table 2.
| Axis | TP | TN | FP | FN | Accuracy (%) | Classification Bias | Axis Score |
|---|---|---|---|---|---|---|---|
| A1 | 0 | 117 | 2 | 121 | 48.75 | −0.98 | 0.0811… |
| A2 | 0 | 118 | 1 | 121 | 49.17 | −0.99 | 0.1515… |
| A3 | 73 | 50 | 69 | 48 | 51.25 | +0.18 | 0.0178… |
| A4 | 0 | 118 | 1 | 121 | 49.17 | −0.99 | 0.4286… |
| A5 | 0 | 118 | 1 | 121 | 49.17 | −0.99 | 0.2718… |
| A6 | 20 | 95 | 24 | 101 | 47.91 | −0.63 | 0.0269… |
| A7 | 1 | 118 | 1 | 120 | 49.58 | −0.98 | 0.0876… |
| A8 | 121 | 0 | 119 | 0 | 50.41 | +1.00 | 0.1851… |
| A9 | 116 | 1 | 118 | 5 | 48.75 | +0.95 | 0.0927… |
| A10 | 121 | 0 | 119 | 0 | 50.41 | +1.00 | 0.1844… |
| A11 | 115 | 3 | 116 | 6 | 49.16 | +0.93 | 0.0336… |
| A12 | 121 | 0 | 119 | 0 | 50.41 | +1.00 | 0.1673… |
| A13 | 0 | 118 | 1 | 121 | 49.17 | −0.99 | 0.0909… |
TP, True Positive; TN, True Negative; FP, False Positive; FN, False Negative.
Truth table with axis score and classification bias for individual axes.
TP is where the model correctly predicts the positive class. FP is where the model incorrectly predicts the positive class. TN is where the model correctly predicts the negative class. FN is where the model incorrectly predicts the negative class.
Classification accuracy can be defined as the percent of predictions that the model identified correctly.
The CB shows how heavily the classification is weighted toward positive or negative values against the axis:
An AS closer to 0 represents a more evenly distributed classification, and thus a better polarization axis. Values closer to ±1 indicate a poorly chosen axis. Affirmative values are those which demonstrate a high cohesiveness of the chosen axis to the subject of the corpus, based upon accuracy of classification of the validation set, CB, and AS. An axis which classifies the corpus accurately with low bias and high cohesiveness is a well-chosen axis which accurately represents the polarization of sentiment between users in the context of this particular political issue.
6.1. Single Axis
Table 2 presents the results of each single axis, A1 to A13. Affirmative values are bolded. For this work, affirmative values were considered to be those of an accuracy close to 50%, CB less than 0.25, and AS above 0.25. The remaining values are taken to indicate rejection of the axis.
From these results it is evident that there is not a clear optimal axis among the proposed axes A1 through A13. Though most axes maintained an accuracy around 50%, this is not a high classification accuracy. While A3 (negative-positive) has a relatively neutral CB, it has a low AS; A4 and A5 have high AS, but extreme negative CB values.
While AS can indicate a finely tuned polarization axis, CB will also be prioritized in identifying the most appropriate axis. Thus, in this case, the standard positive-negative sentiment axis A3 remains the most appropriate axis for analysis.
It is significant that for each of the proposed axes except for A3, the chosen axis words are present in the corpus with significant probability. “Positive” and “negative,” however, do not appear frequently, and thus there is less influence on the calculation of polarization for each input in the absence of either word.
6.2. Combined Axes
In order to improve the metrics of the results of the single or individual axes, the averages of multiple axes were used. This is the vector represented by the mean of values in each dimension of the axes selected. From the single axes in Table 2, the combined-axis classifications were performed, as presented in Table 3, which are reasonably related but not synonymous, and also showed meaningful or promising potential individually.
| Axis | TP | TN | FP | FN | Accuracy (%) | Classification Bias | Axis Score |
|---|---|---|---|---|---|---|---|
| A1 + A10 | 1 | 118 | 1 | 120 | 49.58 | −0.98 | 0.0390… |
| A6 + A10 | 121 | 0 | 119 | 0 | 50.42 | +1.00 | 0.1033… |
| A3 + A6 | 27 | 89 | 30 | 94 | 48.33 | −0.525 | 0.3081… |
| A3 + A10 | 121 | 0 | 119 | 0 | 50.42 | +1.00 | 0.1512… |
| A3 + A6 + A10 | 121 | 0 | 119 | 0 | 50.42 | +1.00 | 0.1187… |
| A3 + A6 + A11 | 119 | 3 | 116 | 2 | 50.83 | +0.96 | 0.0616… |
Truth table with axis score and classification bias for selected combined axes.
One combination of axes, A3 + A6, improves significantly on the AS of each individual axis, while also approaching the mean of the accuracy and CB values, weighted heavily toward the A6 axis' original CB. Actually, the improved performance on these metrics for the (A3 + A6) combination could be preemptively identified by noting that A3 showed a slightly positive CB while A6 was slightly negative, and thus their combination tends toward the middle; the AS improves significantly, from which it can be inferred that the sentiment expressed in these tweets can be extrapolated as a combination of feelings of “negative” and “liberal” versus “positive” and “conservative.” These initial results from combining axes indicates that there may be more potential in exploring multi-faceted sentiment from combining more or different axes.
7. CONCLUSION
This work is a preliminary exploration of a novel approach to SA in the broader view of polarization. What differentiates this work from prior work in NLP, specifically in SA and as it relates to political topics, is that this approach shows that strictly classifying a corpus along a static binary or continuous scale of “negative” to “positive” is no longer adequate. A more abstract and on-demand representation of sentiment as sum of axes, describing that sentiment, is needed.
This work introduces the concept of justifying classification accuracy by additionally calculating the AS as a metric for how accurate the axis of a sentiment is. Though the individual axes did not give particularly promising results, combining axes showed better results. For example, (A3 + A6) gave better classification accuracy, CB, and AS than axes A3 or A6 taken individually. All three of the resulting metrics showed slight improvement. Further (future) work may identify even better approaches to combining axes—for example, using a system of weights, screening axis words by frequency or overall relation to the corpus, and so on.
8. FUTURE WORKS
There is a wealth of opportunity for further research to refine this approach and attempt applications in a wide variety of contexts. Using this method, for example, it may be possible to build a profile of a user on Twitter based upon how they historically take a polarized viewpoint on a number of issues. By building this profile, it may be possible to predict the side a user would take on a new issue, or how susceptible they may be to believing or radicalizing around a new piece of information.
Furthermore, there are opportunities to coalesce work in SA with vastly different but equally valuable forms of social platform analysis: building social graphs. It could be seen from building these profiles and associating users by their social interactions on different platforms, that users of similar profiles tend to cluster, or tend to have positive interactions with users of similar profiles and negative interactions with users of relatively opposing profiles. The method of utilizing prior work in Word2Vec models for text interpretation to generate our proposed AS metric will be cataloged as another heuristic for SA to use in a broader range of NLP tasks.
CONFLICTS OF INTEREST
No conflicts of interest.
AUTHOR'S CONTRIBUTION
The paper was conceptualized by Mr. Wilber and Dr. Bagui. Ms. Ren helped in the data collection and preprocessing piece. Mr. Wilber did most of the programming and the paper was composed by Dr. Bagui and Mr. Wilber.
ACKNOWLEDGMENTS
This work has been partially supported by the Askew Institute of the University of West Florida.
REFERENCES
Cite This Article
TY  - JOUR
AU  - Sikha Bagui
AU  - Carson Wilber
AU  - Kaixin Ren
PY  - 2020
DA  - 2020/10/24
TI  - Analysis of Political Sentiment From Twitter Data
JO  - Natural Language Processing Research
SP  - 23
EP  - 33
VL  - 1
IS  - 1-2
SN  - 2666-0512
UR  - https://doi.org/10.2991/nlpr.d.201013.001
DO  - https://doi.org/10.2991/nlpr.d.201013.001
ID  - Bagui2020
ER  -


