
Revised 21 August 2022
Accepted 13 October 2022
Available Online 14 November 2022
- DOI
- https://doi.org/10.55060/j.jseas.221114.001
- Keywords
- CarEs
Affective computing
Autonomous driving
Stress
Car emotional model
MDSE
Driving style
HMI - Abstract
Autonomous driving is a growing research field, that still has many challenges. The main challenges are related with decision-making algorithms, human-machine interaction and acceptance in the technology. Also, the absence of human drivers in autonomous vehicles creates a gap between users and pedestrians interacting with the vehicle. This article aims to define vehicle awareness, that eases the collaboration with users to improve safety and have a more human-like driving to increase the technology acceptance. In addition, our approach can be extended to express vehicle social awareness towards the pedestrians and road users. Our approach is based on affective computing. Affective computing is a tool to grant computers to genuinely become intelligent and interact better with humans. Moreover, one of its components is the generation of emotions, of which two of the most important elements are cognitive emotions and primary emotions. The article’s objective is to design the model of a primary emotion component, based on safety and that can be personalized depending on the driving style of the user. This component is called the stress factor. The stress factor is correlated with the probability of an accident. The vehicle stress factors contain parameters that can be personalized as a function of a driving style. The stress factor is then attached to an existing cognitive emotion system (CarE) in the automotive domain which we called CarEs. The results of the system behavior showed promising results. The stress factor showed to be useful as a safety indicator. Also, the stress factor can be personalized with the vehicle operation state component. In conclusion, the new system known as CarEs generates vehicle awareness, by improving the vehicle’s collaboration with the driver. The collaboration has a positive impact on the vehicle’s safety and comfort, and people’s reliance on automated vehicles.
- Copyright
- © 2022 Eindhoven University of Technology. Published by Athena International Publishing B.V.
- Open Access
- This is an open access article distributed under the CC BY-NC 4.0 license (https://creativecommons.org/licenses/by-nc/4.0/).
1. INTRODUCTION
A growing research field in the automotive domain is related to the autonomous vehicle. However, the research mainly addresses innovation varying from architecture models, sensing and perception technology to human-machine interactions Yurtsever, et al. [1]. In addition, Yurtsever, et al. describe some current challenges to achieve total automation such as lack of accuracy in decision making algorithms, communication technologies development, and human-machine interaction development. Similar conclusions are drawn from Kang [2] where a specific challenge is related to the difficulty of a self-driving car to make decisions by matching traffic rules with contextual information. Moreover, Coicheci, et al. [3] discusses other challenges related to environmental aspects affecting the functionality of sensors. Finally, a non-technical challenge has also been considered in Choi et al. [4], where user trust is investigated and a conclusion stated that providing transparent information on the system’s operation improves user trust. These challenges paint a picture of difficulties in decision making, failure management and their impact on the system. However, human-machine interaction, and trust are still open challenges for the current and future levels of autonomy in vehicles.
Nevertheless, the development in the automotive domain already had a significant impact on human society. Already, the autonomous vehicle promises to increase the level of comfort, convenience, and safety for its occupants. The absence of human drivers in autonomous vehicles creates a gap in the way drivers and vehicle occupants interact and communicate with the vehicle. Moreover, the future vehicle will be intelligent, expressing states of self and social awareness, which makes the interaction with its occupants, pedestrians, and road users differently than using the traditional communication strategies. The degree of future autonomous vehicle acceptance depends on its ability to express emotions based on its sensor data, as a response to some type of input from the physical environment and its internal components.
To address the vehicle’s emotional awareness a combination of several popular approaches can be used. In this article, we proposed an approach based on affective computing. In this approach we aim to define vehicle awareness, so a vehicle can collaborate with the driver to improve the driving style and safety. Furthermore, this approach intends to be used by autonomous vehicles to have a more human-like driving to increase the technology acceptance. Moreover, our approach can be extended to express social awareness in a vehicle towards the pedestrians and road users, which can have a positive impact on traffic safety.
Affective computing studies and develops systems that can recognize, express, generate emotions and have emotional intelligence. According to Picard [5] emotions are essential to have a computer that is genuinely intelligent and can interact with humans. Also, Picard defines a four-component model to generate emotions. The first component is emergent emotions. An example of emergent emotions is the sad face on a Windows OS computer after crashing. Primary emotions is the second component. Primary emotions are innate to humans. Their function is to trigger a fast and reactive response in dangerous situations. Cognitive emotions, the third component, are generated using cognitive reasoning. Finally, emotional experience, the fourth component, requires the recognition of the emotional state and the acknowledgment of how the emotions affect the system.
Moreover, according to Kraus et al. [6], the implementation of emotions in an autonomous vehicle can enhance acceptance and comfort. Also, Chen et al. [7] designed a framework of vehicle emotion system (VES) to estimate the vehicle health condition by considering different factors including driving habit, maintenance of the vehicle, road condition and usage frequency and kilometers traveled by the vehicle. By implementing emotions in a vehicle, positive effects are observed on its life-span, appearance, security and comfort.
Nonetheless, the previous studies have not tackled the design of a primary emotion component based on the safety of the driver. Therefore, the primary goal of our research is to design a primary emotion component for an emotion vehicle model. We performed an investigation of the emotional vehicle model CarE [8], and we extend it by adding a second Picard’s components for an emotion generation machine. The primary emotion is known as the stress factor, which computes the probability of an accident based on the vehicle’s internal and external inputs. The stress factor conceptualization is motivated by human stress, which cannot be eliminated or decreased unless the stressor (external or internal disturbance) is removed. Finally, this article aims to personalize the stress computation, particularly, in the vehicle’s operation state component (VOS). The personalization of the stress is implemented by introducing inputs which depend on the user’s driving style. The stress factor also interacts with the cognitive emotions computation to personalize them.
To test our approach, a framework was designed and tested using MATLAB/Simulink, and a 3D virtual environment developed in the Unity Game Engine. The tests showed promising results on the use of the stress factor to extend the computation of different emotions as a function of specific scenarios and the personality of the driver. An emoji is used to express emotions to the driver in a graphical method, also all the emotions are communicated to the user in bar graphs.
The structure of the article is as follows. First, the System architecture section describes the system modules: Input, Health and Emotion modules, and the construction of the Stress and Scenario detection modules. Second, the CarEs testing and expected results section describes the testing scenarios, software used and the expected results. Third, the Results section describes the results obtained on each test simulation. Finally, the section Discussion and conclusion discusses and concludes the findings of this article.
2. BACKGROUND
2.1. Emotions in Robotics
There are many application domains in which robots are utilized [9], bringing the interactions with humans onto a more natural level by expressing emotions [10,11]. As presented in many studies, the robots expressing emotional states are easily integrated, trusted and accepted by humans in their deployment in our daily lives [12,13].
Wang et al. [14] investigated the emotional expressions of non-humanoid robots in the past ten years, summarizing core aspects including emotion models, output modalities, evaluation measures, as well as user perceptions. However, more than half of the Wang et al. reviewed articles employed basic emotions, which were mostly derived from Ekman’s six emotions [15].
2.2. Emotions in Autonomous Vehicles
Al-Shihabi et al. [16] defined a framework for Modeling Human-like Driving Behaviors For Autonomous Vehicles in Driving Simulator, which allows modeling different kinds of human driving behavior for autonomous vehicles within a driving simulator. The main conclusion was that the deployment of autonomous vehicles with their human-like driving characteristics would make the simulator’s virtual driving environment more realistic and less predictable.
Hecker et al. [17] extended the objective of autonomous driving models from accurate driving to accurate, comfortable, and human-like driving. The driving models were mathematically formulated, and then translated into one neural network which is end-to-end trainable. However, they did not consider emotions in their approach.
Choi et al. [4] examined the user’s adoption aspects of an autonomous vehicle, as well as to investigate what factors drive people to trust an autonomous vehicle. The results demonstrated that perceived usefulness and trust are major important determinants of intention to use autonomous vehicles.
Molnar et al. [18] found that driving-specific control preferences were significantly related to the reported trust. The authors found evidence that trust in automated driving, was an important component of acceptance of the technology.
2.3. CarE Model
The emotional vehicle model CarE from Chouhan [8] is a system that calculates emotions as a function of a cognitive appraisal. CarE implemented the Em model by Reilly [19] to generate emotion. Em model is based on OCC theory [20], which can describe emotions and their intensities using a series of equations and algorithms. The Em model simplifies some of the computations of the OCC theory.
CarE is capable of computing 22 emotions, its requirement as input are goals, agents, events and actions. The input allows CarE to interpret the data and understand the situation to generate an emotion. The interpretation is based on a database (DB) which concentrates possible goals, agents, events and actions. They need to be identified and then process.
A goal is a specific objective in a driving circumstance. For example, if there is a leading vehicle and the overtaking lane is free, the objective is to overtake the leading vehicle. There are two important parameters in the goal’s DB: the desirability and the likelihood of the goal. First, in the model, the desirability is split into two parts: the DoS (Desirability of Success) and the DoF (desirability to not fail). The DoS is the desired level of success in the goal, while DoF determines the level to not fail. The likelihood is also split in two parts: LoS (likelihood of success) and LoF (likelihood of failure). In CarE model the likelihood is modeled as complementary variables, following the equation LoS + LoF = 1.
An agent is defined as the entity that performs the actions causing the event, e.g. the autonomous vehicle or a pedestrian. An important agent’s parameter is the appealingness, which defined the level of attractiveness of that agent to the CarE, they can have negative or positive values.
An event is defined as the entity’s judgment on a situation, according to Chouhan [8] the judgment should be independent to the entity’s believes. Its relevant parameters are the dLoS (change of LoS) and dLoF (change of LoF. These two parameters compute the change on the likelihood once the event has taken place.
An action is defined as the resulting act in the event. Its parameters are the praiseworthiness and the responsibility. Praiseworthiness is the standardized appraisal considered by the entity performing that action. In CarE the praiseworthiness is of moral nature, based on the agent’s responsibility perception of the performed action.
The four previously mentioned inputs are processed in a rule-based manner. For instance, Fig. 1 shows the interaction of an action, event, and agent to compute an emotion. First, the action is detected, then the event’s change of LoS (dLoS ) and change of LoF (dLoF) is evaluated. Depending on its values then the agent is evaluated to generate positive (gratification or gratitude) or negative (remorse or anger) emotions. Equations defined in the Em model [19] are used to compute the intensity of the emotions.
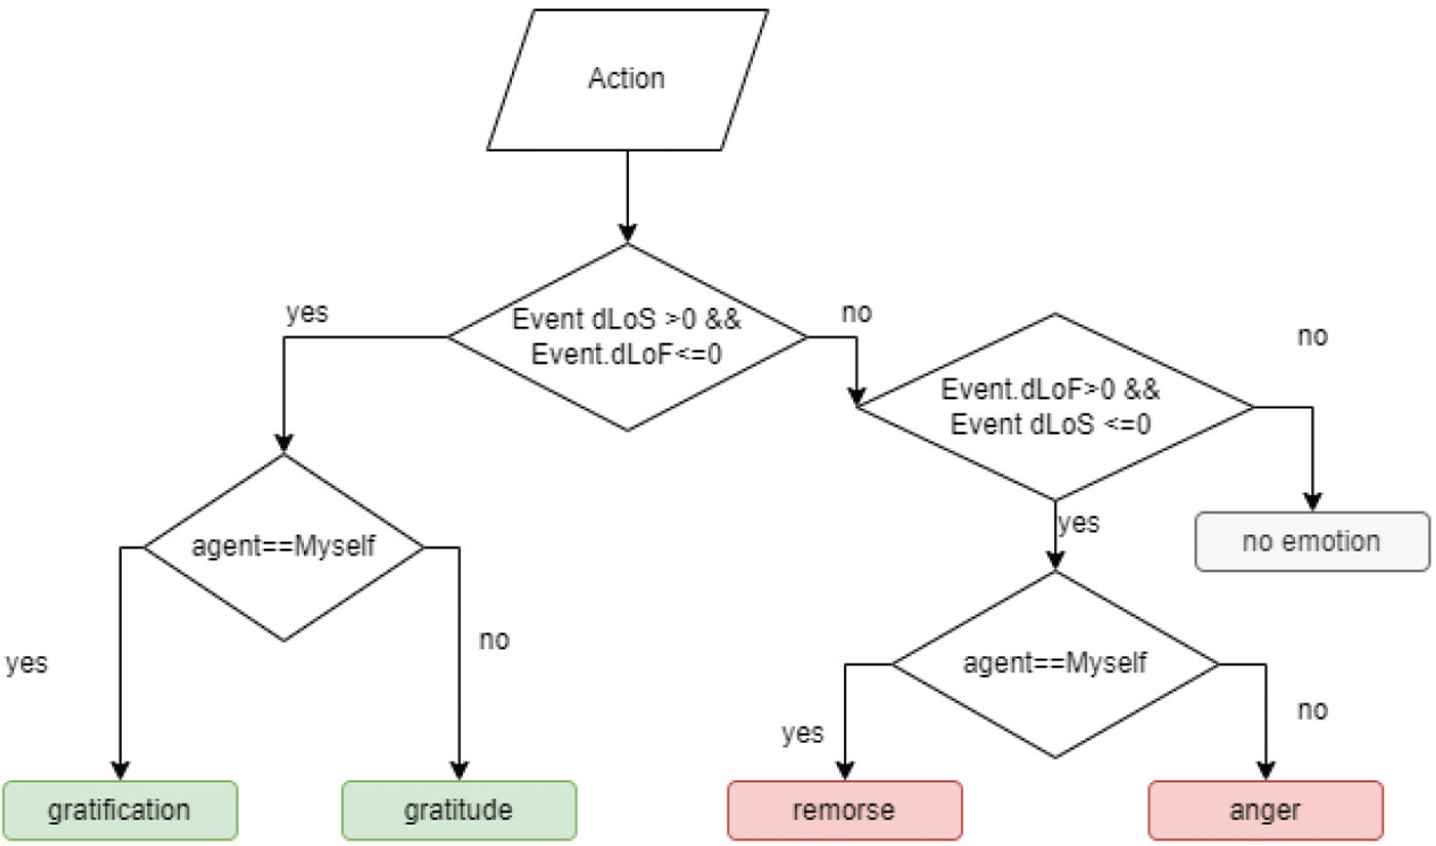
Algorithm example to compute emotions [8].
For example, Fig. 1 shows how the algorithm computes the gratification emotion, its intensity is calculated as specified in Eq. (1). All the equations needed to compute the intensity of each emotion can be found in Chouhan [8].
Em model mapped 22 emotions to six basic emotions. Fig. 2 shows how each of the 22 emotions are mapped to the six basic emotions defined in the Em model. The rules to map the 22 emotions are described in Chouhan [8].
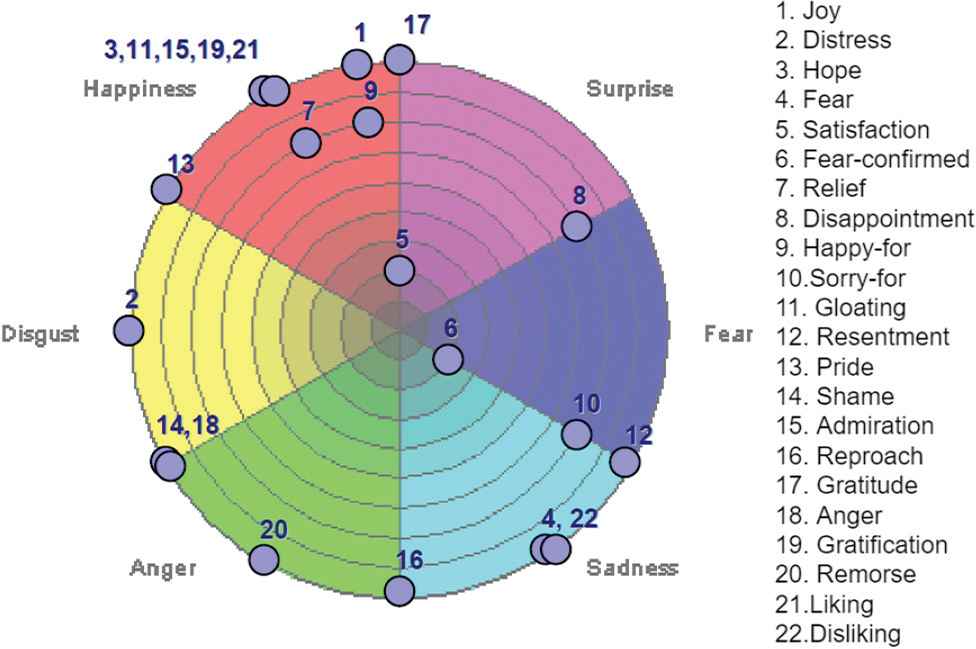
22 emotions mapped to six basic emotions [8].
CarE is composed of five modules. Fig. 3 shows the high level architecture of CarE. A summary of CarE’s modules is presented next.
Components and data flow of CarE system.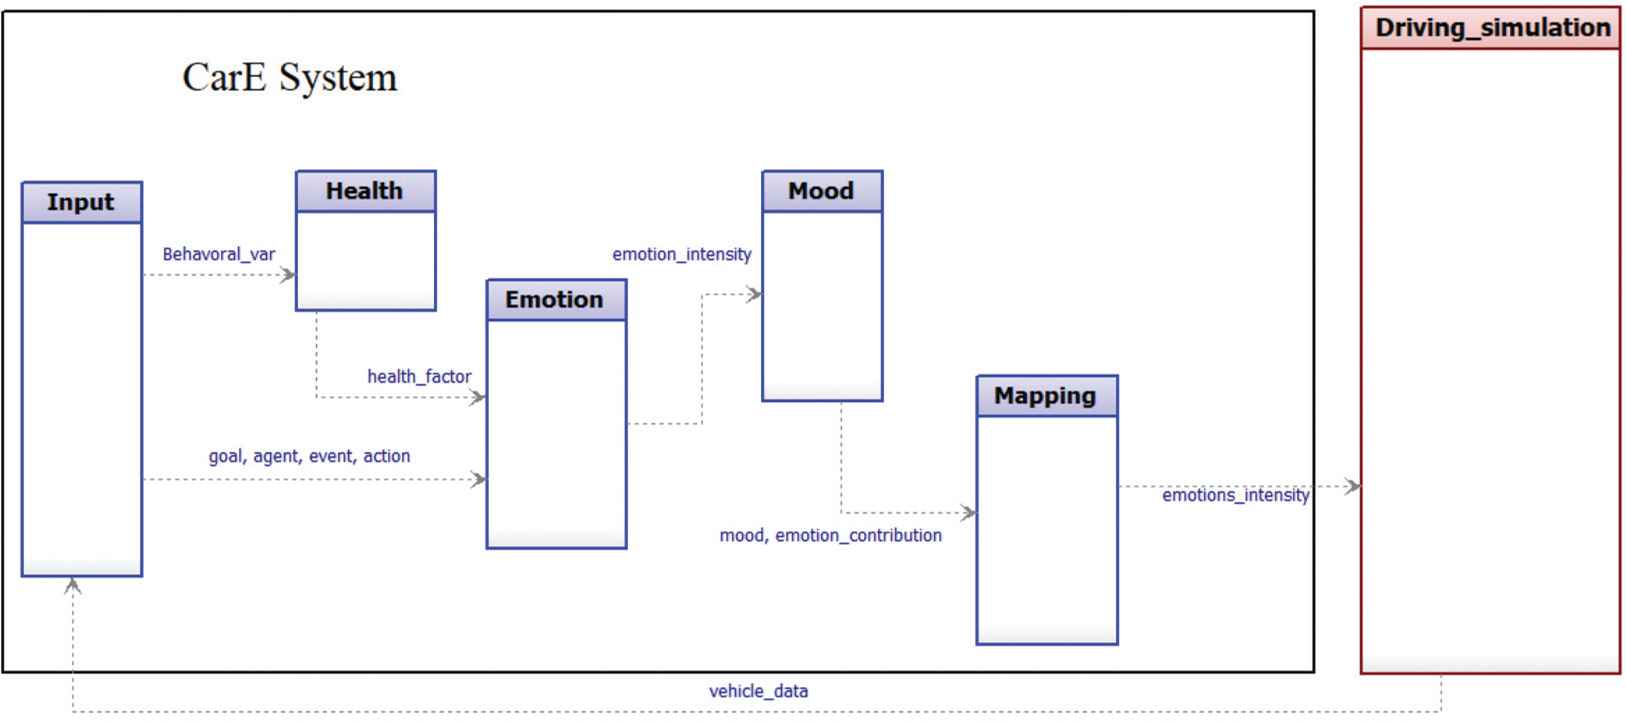
- 1.
Input: It processes data coming from external systems, the input is then transformed into states, they are known as behavioral variables. Some data is not transformed into state, such as the data of speed or location of the vehicle.
- 2.
Health: It computes the health factor as a function of the states variables and the stress factor. The HF is an indicator of the overall system’s health.
- 3.
Emotion: This module computes the emotions and their intensity, as explained previously.
- 4.
Mood: Its input is the intensity of the 22 emotions from the EmotionModule. It analyses all the emotions and computes its mood, which is the ratio of the intensity of the positive emotions over the negative emotions.
- 5.
Mapping: It maps the 22 emotions into the 6 basic emotions. The mapping rules can be observed in [8].
3. CarEs ARCHITECTURE
CarEs system was developed using the MDSE methodology SYSMOD [21], starting with the system’s requirements elicitation, and continuing with the realizations of the use cases. The system’s main requirement for the primary emotion is considered to be passengers’ safety, based on a mathematical model of an accident probability. Also, the system required to consider the stress resiliency of the driver. Therefore, a component related to the driving style is design as a function of the adaptability to stress while driving. In other words, if a driver can drive at high speeds is because the driver is more resilience to stress due to speed, and this is reflected in the model.
The architecture of CarEs is presented in Fig. 4. CarEs has two extra modules, which are connected with the CarE system: Stress and Scenario Detection modules. In addition, CarE modules Input, Health, Emotion, and Driving simulation were modified.
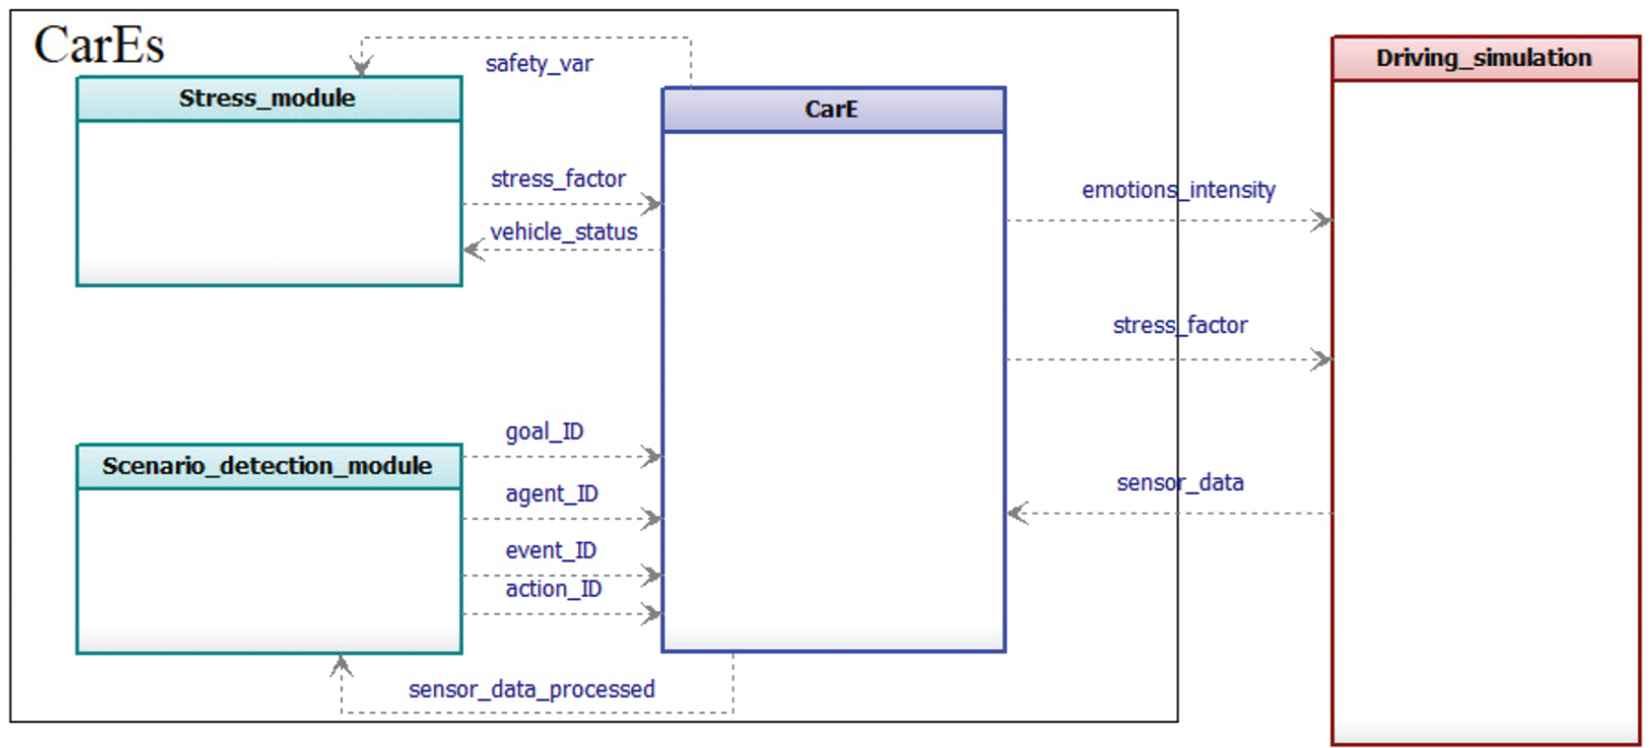
Schematic representation of the CarEs system.
Before explaining the functionalities of each module, Subsection 3.1 describes the parameters used to personalized three different driving styles, that are fundamental to construct a human-like driving machine or driving assistant. The following subsections describe the modules changes and new modules features.
3.1. Driving Style Parameters
The driving style is defined by Marina Martinez et al. [22] as “the way a driver operates the vehicle controls in the context of the driving scene and external conditions”. Thus, the driving style plays an essential role in the safety and performance of the vehicle.
In autonomous driving, the driving style can aid to adjust the vehicle’s operation to the drivers needs. Each driving style has its own “traits” related to the operation of the vehicle. There are many driving style classifications [23–25]. We have chosen a classification based on Dörr et al. [25] approach, which considers three style types: sporty, normal, and calm. This classification correlates the aggressiveness of the driving style with parameters such as average speed. Ifa driving style is more aggressive the average speed is higher.
The parameters definitions and values used to characterize a normal driver style are extracted from Bonsall et al. [26]. All the parameters selected are shown in Table 1.
| Parameter | Unit | Values |
|---|---|---|
| Speed ( |
m/s | Calm = 6.9 Normal = 13.9 Sport = 20.8 |
| Headway (Hw) | s | Calm = 3 Normal = 2 Sport = 1 |
| Acceleration rate (ārate) | m/s2 | Calm = 0.6 Normal = 1.2 Sport = 1.8 |
| Deceleration rate ( |
m/s2 | Calm = 0.5 Normal = 1 Sport = 1.5 |
| Critical gap (Gc) | s | Calm = 5.25 Normal = 3.5 Sport = 1.75 |
Driver style parameters for different styles.
The parameters for the calm and sport styles were computed assuming the calm style is less aggressive than the normal, and the sporty style is more aggressive than the normal [25]. The generation of the parameters aims to observe the behavior of the system for each style. Hence, the parameters for the calm personality are decreased 50% from the normal driving style, while the sporty driving style is increased 50% from normal driving style.
3.2. Input Module
In CarE [8] system the Input module has five classes: a) Drivers health – variables related to driver’s health, b) Driving style – variables related to driver’s vehicle operation, c) Vehicle health – variables related to the vehicle’s components state, d) Vehicle competency – variables related to vehicle’s capability for autonomous driving, e) Environment condition – variables related to external environmental conditions. New behavioral variables were added in the vehicle health class, which follows EU road-worthiness directive [27].
In addition, a new definition to rank the behavioral variables was designed. The new rank definition classifies the behavioral variables with a different prioritization then in CarE [8]. First priority is their impact on safety with the rank of 1 and weight of 1, second is performance with a rank of 2 and weight of 1/2, third is driver’s comfort with a rank of 3 and weight of 1/3, and fourth is driver’s trustworthiness with a rank of 4 and weight of 1/4.
Each variable was classified by performing a literature review on its impact on each ranking class. For example, the breaking equipment state is classified as a safety concern by [27]. This new ranking is used to compute the health module.
3.3. Health Module
The changes in the health factor (HF) are related to the manner the stress factor (SF) influences its computation. The values of the stress factor are within the range of 0 to 1. To compute the new HF affected by the stress (HFs), Eq. (2) is used.
Eq. (2) shows that the SF can only affect negatively the HF, but the SF cannot reduce the value of the health factor below 1. Thus the stress factor influence decreases in accordance with the proximity of the HF with its lowest value. The value of the health factor affected by stress (HFs) is an input to the emotion module.
3.4. Stress Modules
The stress factor is conceptualized as the probability of an accident, considering four components: (1) the vehicle operation state (VOS), related to the driving style of the user; (2) vehicle’s health; (3) the capability of the vehicle to autonomous driving and the (4) environmental conditions.
3.4.1. Vehicle Operation State (VOS) Stress
We proposed two components of VOS stress (SFvos), the probability of losing control and the probability of collision with another vehicle. This article does not compute the non-moving collision probability, because there are many non-moving objects in the 3D environment. Thus, the objects detection signal generates noise making the computation inaccurate. Also, the behavior of a moving object becomes a priority in a traffic simulation due to their unpredictable behavior.
The component probability of loss control computation is based on Eboli et al. [28] in which a methodology is presented to identify safe and unsafe conditions zones as a function of the vehicle’s speed and acceleration. Eboli et al. define the vehicle generated force magnitude (Fs) as a function of its acceleration, and the maximum friction force magnitude of the tires with the road (FR ) as a function of the vehicle’s speed [29]. Then, it defines the safe and unsafe zones as follows:
- •
if Fs < FR the vehicle is in the safe driving zone.
- •
if Fs = FRthe vehicle is at the limit of the safe driving zone.
- •
if Fs > FR the vehicle is in a unsafe driving zone.
Then, we derived the risk of losing the control indicator (Rlc) of the vehicle in Eq. (3):
Lastly, to model the Rlc as a probability, an exponential pdf (probability density function) is used. The exponential pdf is used because it has the memoryless property, and we assume that every driving operation states are independent. This assumption is valid because we are computing the Rlcwith instantaneous acceleration and speed. The probability measurement is called the stress factor of control loss (SFCL).
The second (VOS) stress component is the moving object collision probability (SFcol). The definition of Time to Collision (TTC) [30] is used to compute the (SFcol).
According to the definition of TTC, when the TTC decreases the risk of a collision increases. Furthermore, according to Elvik [31], the increase in speed can increase exponentially the risk of an accident. Hence, SFcolis modeled as an exponential pdf, and it is a function of the vehicle’s speed. Eq. (5) describes the SFcol:
The total VOS stress factor (SFvos) is model as a mutually inclusive probability and defined in Eq. (6).
3.4.2. Failure Stress
We propose to use the theory of predicted maintenance to model the failure stress. The methodology to predict a failure is based on Shafiee et al. [32], where for each vehicle’s component (j), the variables of a critical level of degradation (Dj), degradation rate (λj), mean and standard deviation distance for each component (μj, σj) needs to be defined. The values of the variables were extracted from a literature review [33–38]. For the components where these values were not found, this article assumed that their Dj, λj, μjand σjwere equal to the parameters of the vehicle life expectancy. This article assumes the degradation rate (λj) is linear, this assumption allows the computation to be in real-time. Although a more realistic approach should be further explored. Moreover, we used the gamma probability density function to model the probability of survival.
Shafiee et al. [32] computed the survival function of the system (Fsys). Eq. (7) defines the failure stress (SFf) of the system.
3.4.3. Competency Stress
According to Underwood et al. [39], the inattention is important contributor to a vehicle accident. In consequence, the ability to detect objects is a major contributor for accident probability. Similarly, the detection of objects from an autonomous vehicle plays an important role in the capability of autonomous driving. Hence, we propose a methodology to compute the competency stress (SFc) considering the object recognition variable as a central element and it is conceptualized as Probability to not recognized and object (PNRO).
Other vehicle’s systems can enhance the object recognition task. Each of these systems (j) enhance the object recognition task by an improvement percentage (PIj). Therefore, if any of the systems is enabled for the object recognition task, the PNROwould decrease. The systems that can enhance the object recognition task are the vehicle to vehicle communication (V2V), the vehicle to infrastructure communication (V2I), the digital data connectivity and capability for cooperative maneuvering and sensing.
The competency stress (SFc) computation is shown in Eq. (8), defining how each PIj affects the (PNRO) of the system from N subsystems.
Consequently, the uncertainty of the object recognition decreases if the subsystem j is enable in the system. In the scenario that the sub-system is not enabled (PIj = 0 ) then it does not affect the (PNRO).
3.4.4. Environmental Stress
Ifthikar et al. [40] proposed the design of a system that can detect road accident’s hot spots. Ifthikar et al. claims the approach can be extended to any road. Therefore, we propose that the environmental stress is computed using as a central variable the Probability of accident in a specific road P(acc) [41]. Other factors such as weather conditions or surface type can increase the probability of an accident.
We proposed a mutually inclusive probabilistic model for the environmental stress (SFenv) computation. Each factor contribution j is named probability increase of accident of factor j (P(AI) j). Thus, the algorithm to compute SFenv is:
- 1.
i = 0.
- 2.
if i = 0 then Ptemp = PAcc.
- 3.
i = i + 1.
- 4.
Ptemp= Ptemp+ P(AI) i − PtempP(AI)i
- 5.
if i = 4 then SFenv= Ptempelse go back to 3.
The probability of an accident on the road (P(acc)) is modeled as a normal pdf, and its mean and standard deviation were extracted from [42] data. To compute the SFenv, four factors are considered as following: i = 1 is the surface condition, i = 2 is the surface type, i = 3 is the weather condition, i = 4 is the time of the day.
3.5. Total Stress Factor
The stress factor (SFtot) is modeled as a mutually inclusive probability of its components.
The steps are described in Eqs. (9) and (10). The equation that computes the stress factor is presented in Eq. (11).
The stress factor can only have values within the range of 0 and 1, as stated in the Eq. (11).
3.6. Scenario Detection Module
This module can detect five different scenarios. The vehicle with the CarEs implemented is called ego-car. Each scenario has start and end triggers. The implementation of the scenario detection module follows these rules. The five scenarios are the following: 1) driving in a straight line, 2) lane change, 3) curve handling, 4) vehicle following, 5) overtaking.
The straight line scenario considers the ego-car driving by itself in the same lane. The initial trigger is the start of the vehicle (speed = 0 ), or the finalization of another scenario. The end of this scenario happens when the ego-car has a starting trigger from another scenario.
In scenario lane change, the starting trigger is considered to be when the ego-car has touched the lane marker. The lane change end trigger is when the vehicle has touch the lane market with the opposite rear set of tires [43].
The curve handling scenario has a specific starting trigger, which happens when the street starts changing from a straight line into a curved line. Using as a reference the direction of the vehicle, the angle of the curve could be positive, making a left turn, or negative, making a right turn. The end trigger happens when the street angle is in line, zero degrees with the ego-car.
The vehicle following scenario happens when the ego-car has a leading vehicle. The starting point has three triggers. First, another car must be in the same lane as the ego-car. Second, the leading vehicle must be in the same direction. And third, the ego-car must be located behind the leading vehicle. The end trigger can be either when the leading vehicle is no longer in the same lane or the leading car change road.
The overtaking scenario has many variants. In this article only one variant was considered. This variant has the same three starting triggers as the scenario vehicle following with an extra trigger, which is the lane change of the ego-car with the intention of leaving the leading vehicle behind [44]. This variant assumes that there is only the leading car and the ego-car present in the scenario.
3.7. Emotion Module
The Emotion Module is composed of two sub-modules: Intensity Module and Decay Module. Intensity Module generates intensity values of emotions based on its input parameters. These inputs are Goal ID, Action ID, Event ID, and Agent ID. For the computation of the emotions, a database relates those ID’s to its parameters and computes the intensity values of 22 emotions. The Decay Module takes the output of the Intensity Module as input and decreases the intensity values of the emotions with time. Two important parameters in the database of a goal is the likelihood of success (LoS) and the likelihood of failure (LoF). These parameters contain the probability of the goal being successful or failing. However, the parameters are complementary implying that LoS + LoF = 1. In CarE [8], the parameters were fixed.
Each scenario is correlated with a goal and an agent in the data based. This relationship is shown in Table 2. The relationships between the scenarios, events, and actions are shown in Table 3.
| Scenario | Goal | Agent |
|---|---|---|
| Driving in a straight line | Stay under the speed limit | Me |
| Lane change | Perform proper lane change | Me |
| Curve handling | Perform proper curve handling | Me |
| Following a vehicle | Maintain proper distance with agents | Vehicle in front |
| Overtake | Perform proper lane change Maintain proper distance with agents Avoid collision with vehicles |
Vehicle in front |
Relationship between scenarios, goals and agents.
| Scenario | Event | Action |
|---|---|---|
| Driving in a straight line | 1. Staying under the speed limit 2. Over-speeding detected |
1. I stayed under the speed limit 2. I over-speed |
| Lane change | 1. Proper lane change performed 2. Improper lane change performed |
1. I performed a proper lane change 2. I performed an improper lane change |
| Curve handling | 1. Proper curve handle performed 2. Improper curve handle performed |
1. I performed a proper curve handle 2. I performed an improper curve handle |
| Following a vehicle | 1. Proper distance maintained with agents 2. Improper distance maintained with agents |
1. I maintained a proper distance with agents 2. I maintained an improper distance with agents |
| Overtake | 1. Proper lane change performed 2. Improper lane change performed 3. Proper distance maintained with agents 4. Improper distance maintained with agents 5. No collision detected 6. Collision detected |
1. I performed a proper lane change 2. I performed an improper lane change 3. I maintained a proper distance with agents 4. I maintained an improper distance with agents 5. I detected no collision 6. I detected a collision |
Relationship between scenarios, events and actions.
This article proposed the use of the SF as a decision variable to identify which event and action are triggered within the scenarios. Furthermore, we implemented the SF to replace the fixed value of the likelihood of failure (LoF). Particularly for the scenarios: lane change, curve handle, and following a vehicle. The threshold to decide between events is SF = 0.5. The threshold rationale is considering that if SF < 0.5 and LoF = SF then LoS > 0.5 thus there is more probability for success than for failure, if SF > 0.5 and LoF = SF then Lo < 0.5 thus there is less probability for success than for failure. In the case SF = 0.5 then the chosen event is the negative one. For example, in the goal perform proper curve handle there are two possible events: proper curve handle and improper curve handle. If the SF >= 0.5 then the event selected should be an improper curve handle.
For the scenario driving in a straight line, the decision variable is based on the detection by the CarEs whether the maximum legal speed limit is surpassed, in which case the event over-speeding is detected.
The scenario Overtake considers six events. Each event depends on the sub-scenario detected. Thus, the event and action selected follow the same rules as for each sub-scenario. If the ego-car has collided the identification variable is the detection of a collision, thus the possible events and actions are no collision detected or collision detected. Each goal, event, action, and agents are in a database consisting of all essential information for the Intensity Module.
4. CarEs TESTING AND EXPECTED RESULTS
This section describes the system testing methodology. Subsection 4.1 presents a simulation environment for testing of the CarEs system. In addition, Subsection 4.2 describes the expected results of the emotions interaction with the stress factor.
4.1. CarEs System Testing
The setup test contains two components, the Matlab/Simulink and the Unity Game Engine. The communication between the two is based on the TCP/IP protocol. The CarEs modules are implemented in Matlab/Simulink. A 3D prototype for the visualization of the five driving scenarios is implemented in the Unity Game Engine. Fig. 5 shows snapshots of the test scenarios.
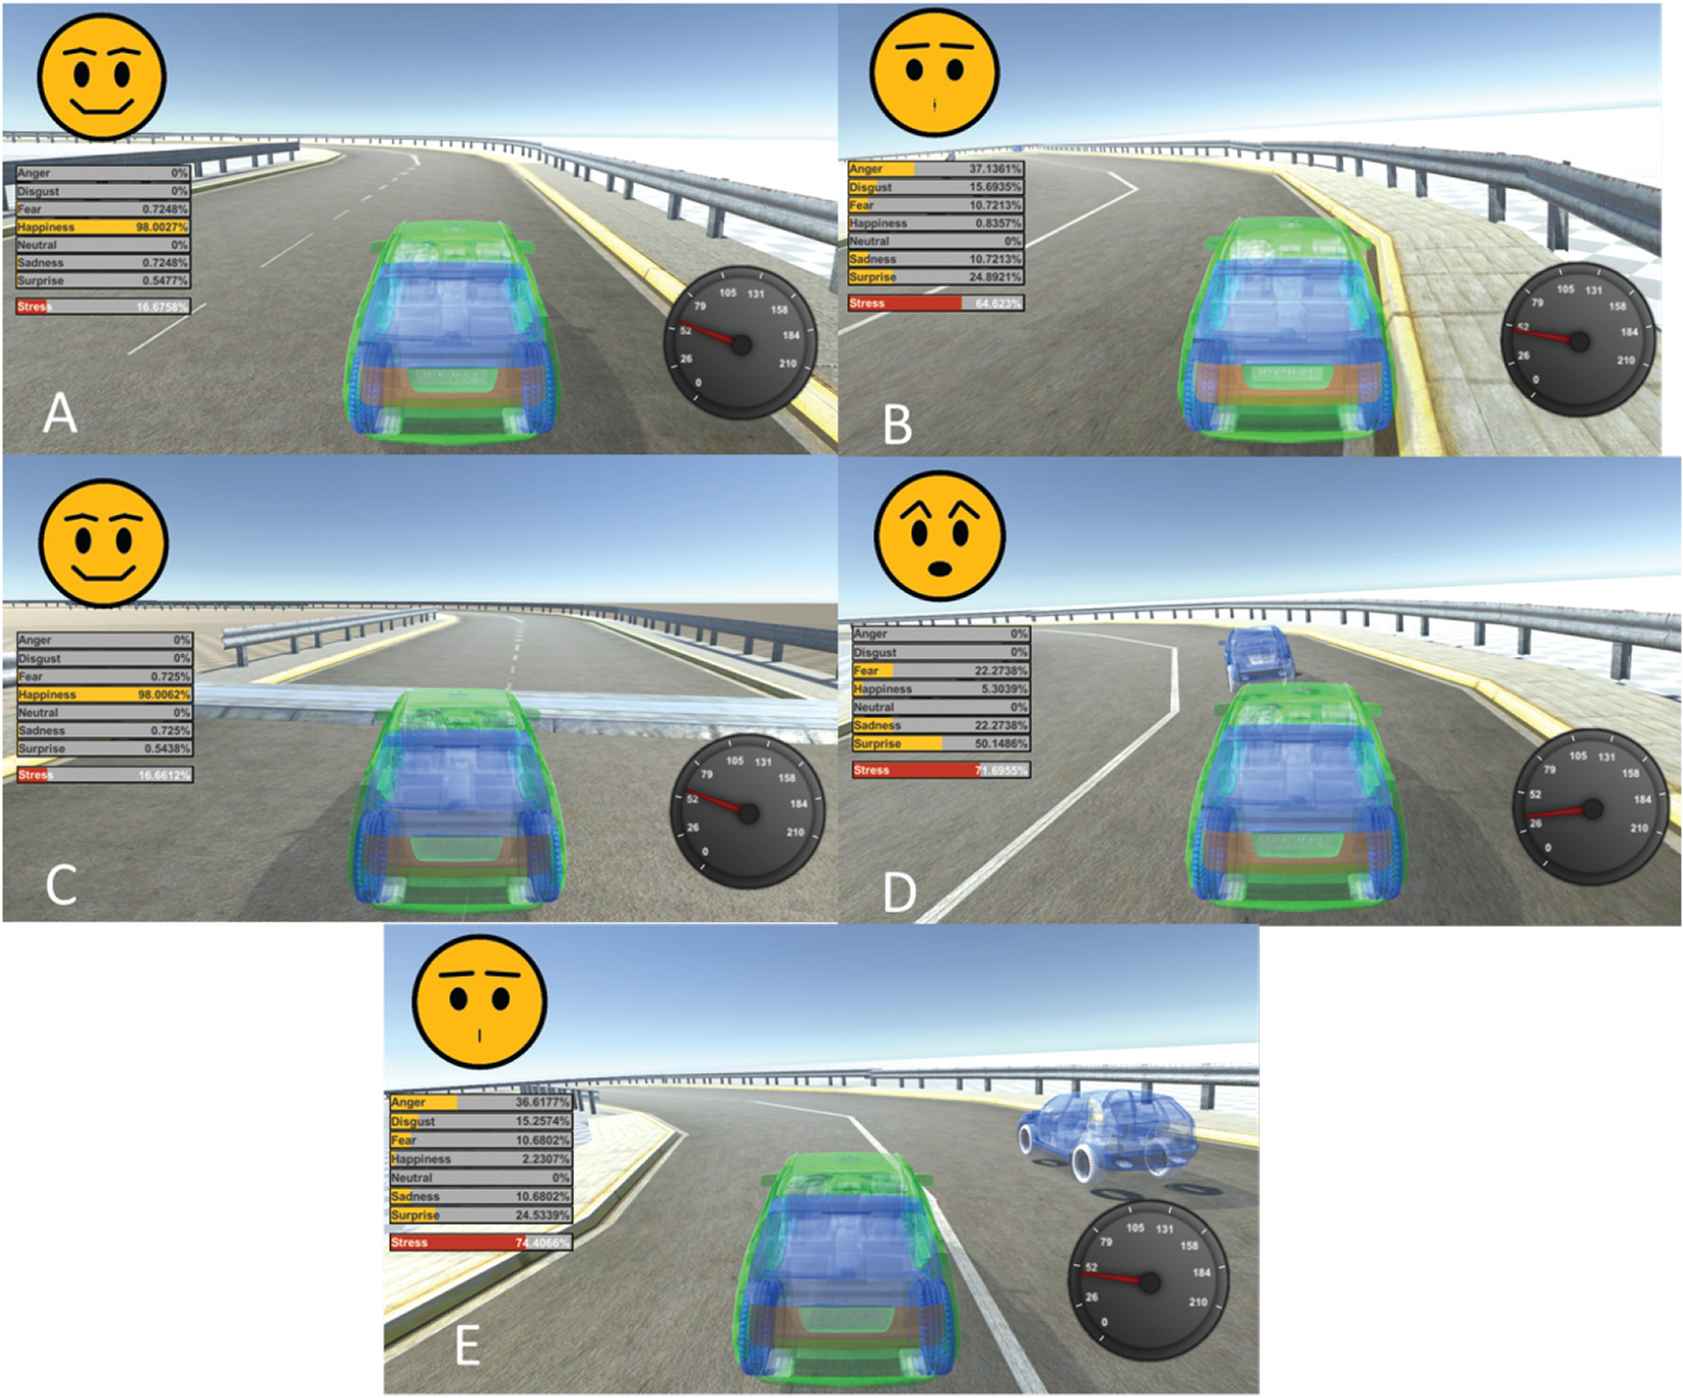
Testing scenarios. A: Driving in straight line, B: Curve handling, C: Lane change, D: Following vehicle, E: Overtaking.
The testing consists of five different scenarios presented in Table 2. These scenarios are design to test the behavior of the CarEs concept. The first three scenarios involve only the ego-car. The 4th and 5th scenarios involve the participation of two vehicles, the leading vehicle and the ego-car. For the first four scenarios, the vehicles are driven for a total of 2.5 [km]. To perform these tests, a specific path was created for each vehicle. In the test of the goal Stay under the speed limit, to trigger the event under the speed limit, the speed limit was set to 60 [km/h], to trigger the event over the speed limit, the speed limit was set to 50 [km/h].
For all the tests, the torque of the vehicle is 530 [Nm]. In the scenario of the car following, the leading vehicle torque is 480 [Nm]. Also, the ego-car is set to approach to leading vehicle to a maximum of 4.5 [m], and no further away than 8 [m]. The gap interval allows the test of object collision probability (SFcol).
Statistical analysis is performed for all the collected data. For each goal and event the values of emotions and stress are collected with fix time rate (0.2[s]). The mean and variance of the emotions and stress value are reported.
These tests aim to investigate the behavior of the stress and the personalizing of the SF. Hence, this set of tests is designed to evaluate the stress factor as a decision index to differentiate between events for the computation of emotions.
The second set of tests aims to observe the differences in stress and emotions values generated on the 3 types of driving styles (DS). Our hypothesis is that the DS calm will experience the stress in a higher fashion than the others, as such the sport will compute less stress in any given event.
4.2. Expected Results
The stress factor is designed to influence emotions, and as an danger’s indicator. Thus, we expect that in goals where the stress factor has less influence, e.g., where the LoS is not dynamic (e.g., speed limit goal), then emotions will not greatly be influenced. However, some negative emotions such as fear or sadness may appear when actual danger is not detected. Therefore, we expect that a goal with a dynamic LoS (e.g., curve handle goal) will show results as a function of situational danger, hence if the stress factor is high then negative emotions are high. Hence, these tests can show if the stress factor has a value as a situational awareness indicator.
To understand the influence of the stress factor (SF), we need to compare the emotions generation in the same scenarios but with a different definition of LoF (likelihood of failure). The stress factor should have a bigger influence when Lof is a function of the stress factor (LoF = SF). Therefore, we expect that in a dynamic LoF the emotions have been influenced greater, e.g., if SF is low positive emotions are greater in dynamic LoF than fixed LoF.
Section 3.1 introduces the driving styles. These styles are characterized by a series of parameters. Considering the definitions stated in Section 3.1, a calm driving style is characterized to drive less aggressively than the other two driving styles, which translates into a more cautious driver. Therefore, in situations where we expect that bad decisions would be taken, e.g., improper distance or curve handling, bad emotions are expected to be more intense for the calm, and the least intense for the sporty driving style. Furthermore, also, we expect that the stress factor is greater in calm than in normal, and greater in normal than in sporty drive styles. This hypothesis is related to the resilience as a function of the aggressiveness of the driving style, which was designed in the parameters expressed in Section 3.1.
5. RESULTS
The results for the scenarios driving in a straight line and curve handling are shown in Fig. 6. Fig. 6 (left) shows the results for the scenario driving in a straight line, and its related goal staying under the speed limit. From the difference in emotional values between the events under speeding and over speeding, it can be seen that the happiness and fear reduces, while anger, sadness and surprise increase. Whereas, the stress value is similar in both cases. The database of the goals show that the agent related is the driver, since, the agent is choosing to over-speed the anger emotions appear. Also, for this goal the LoS = LoF in the database then, the emotion of fear appeared. The results showed the need to have a dynamic LoF so the fear emotion only appears when danger is detected, such as a probability of accident above 0.5.
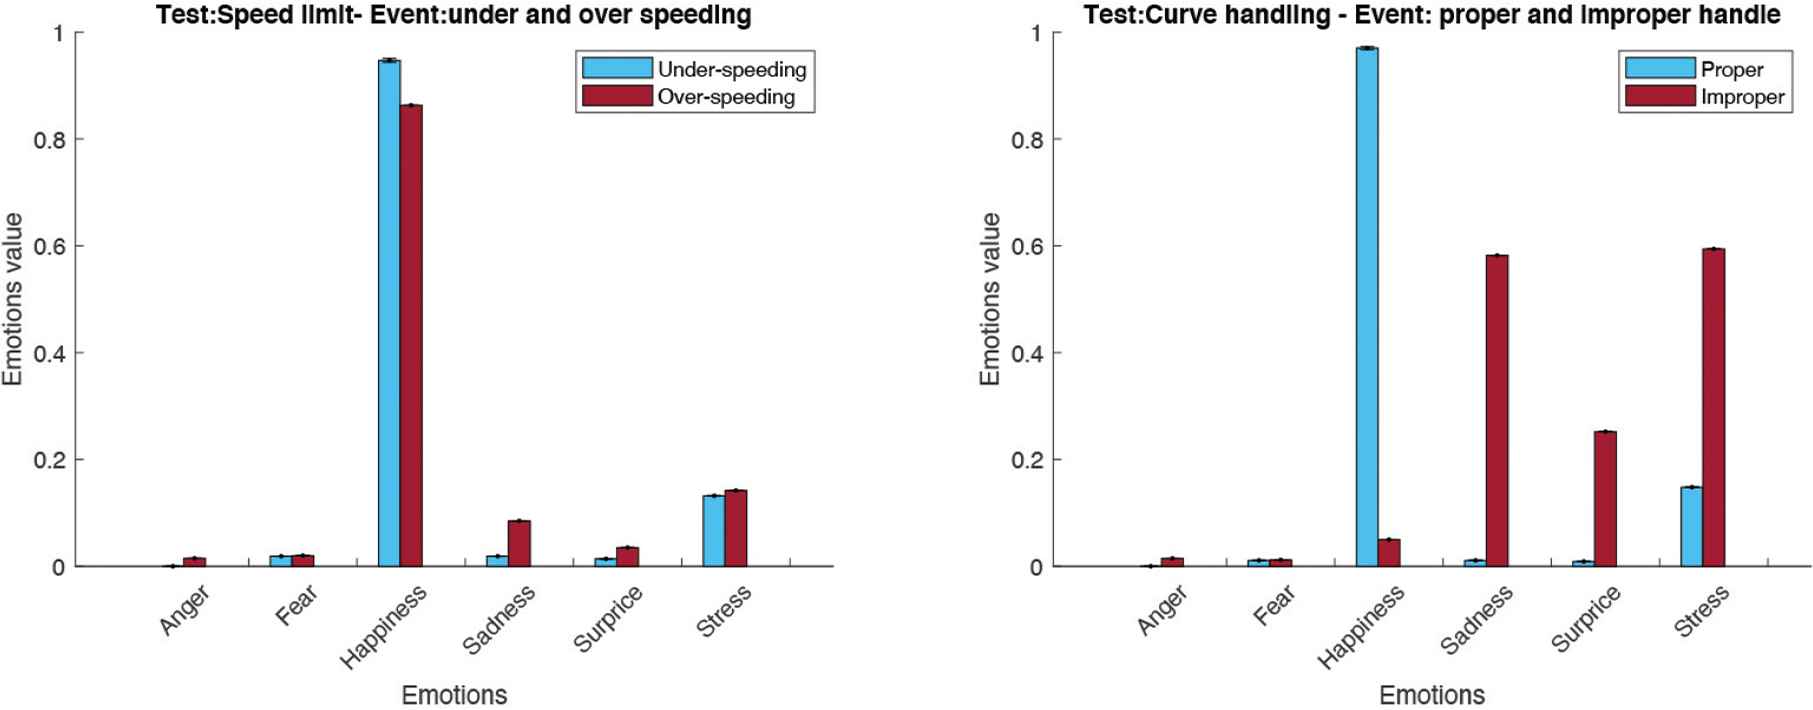
Results. Left: under speed limit. Right: curve handle.
The goal curve handle is shown in Fig. 6 (right). The results showed four emotions for the proper and improper curve handling events. The emotion of happiness dominates the emotion in proper curve handling event. However, sadness and surprise dominate the emotions in the improper curve event. The stress increases significantly for the improper curve handling compared to the proper event, which increases the intensity of negative emotions. Hence, the use of SF as a danger indicator showed to be valuable, as stated in the hypothesis in Section 4.2.
Fig. 7 shows the scenarios lane change and car following tested to compare static LoF and dynamic LoF (LoF = SF). In both scenarios lane change and car following the dynamic LoF showed consistently higher intensity values than the fixed LoF. Hence, the results are in line with the hypothesis shown in Section 4.2.
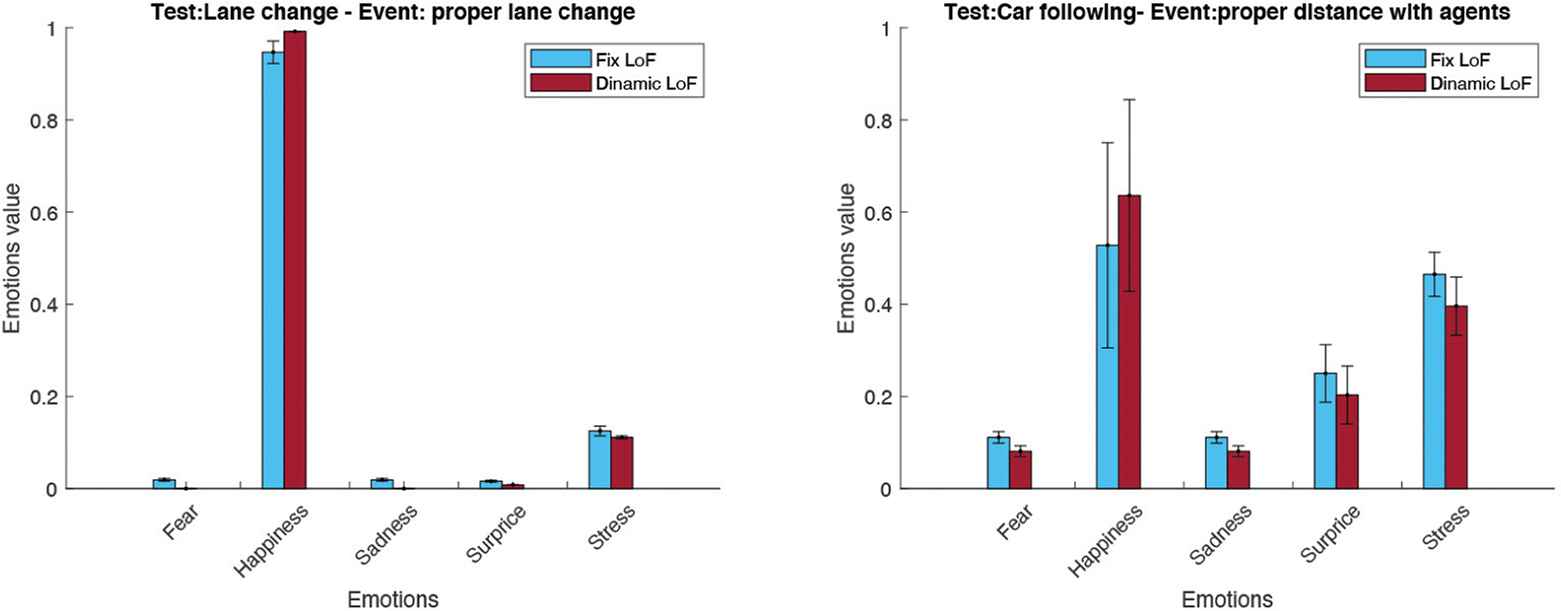
Results. Left: proper lane change event emotions and stress. Right: car following, improper distance.
The results to analyze the behavior of the driving style are shown in Fig. 8. The scenarios chosen for this test were car follows (left) and overtake (right). In both figure shows a clear trend where the stress decreases while the personality of the car increases in aggressiveness. Furthermore, the values of the emotion of happiness increase while the aggressiveness increases, while the value of the emotions anger, disgust, fear, sadness and surprise decreases with the aggressiveness level. Hence, the stress factor personalized the emotion computation according to the classification of calm, normal and sporty scenarios, as explained in Section 4.2.
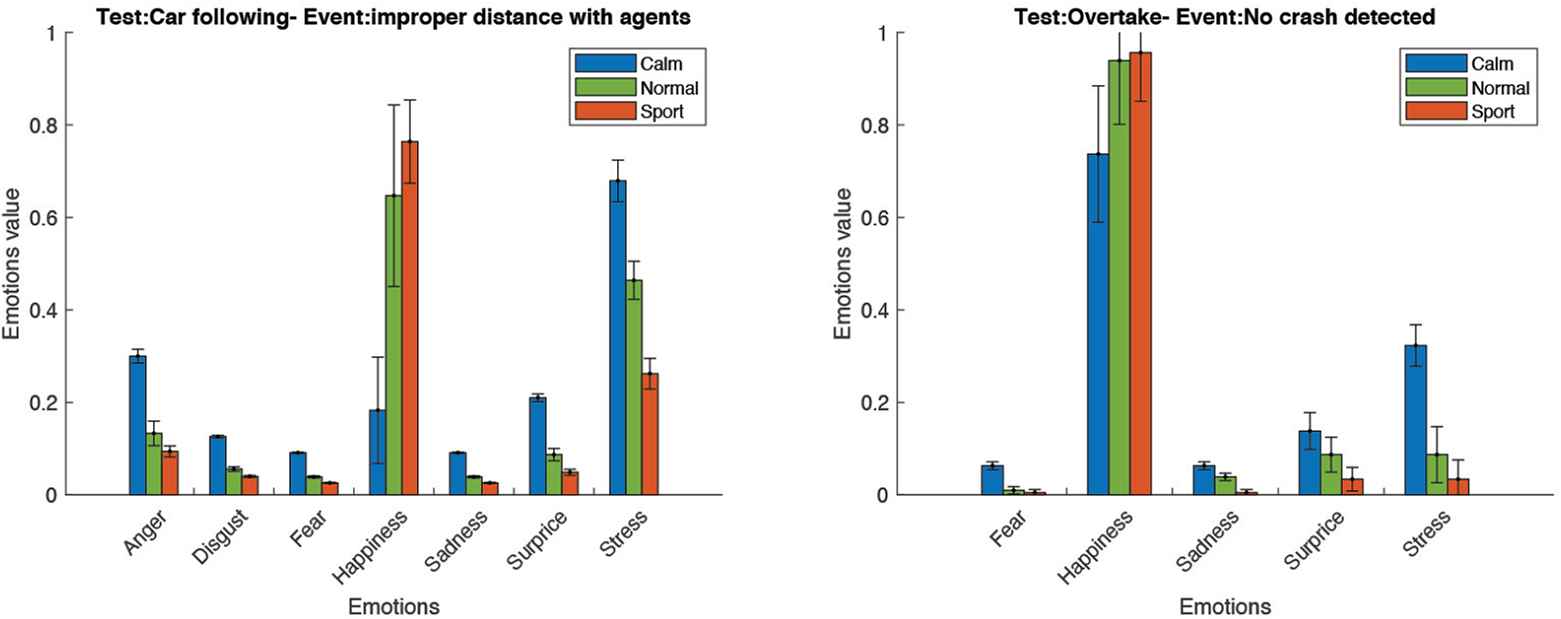
Results. Left: car following, improper distance. Right: overtake, no collision detected.
6. DISCUSSION AND CONCLUSION
This article presented the implementation of a stress factor as part of the computation of emotions and as a decision variable. Finally, this article aims to generate personalizing of the stress factor related to the driving style of the user.
The results showed a successful behavior of the stress factor as an indicator between positive and negative events. Also, from the results, it is noticed that the stress factor can generate a greater set of values for emotions. Thus, the stress factor can be used as a decision variable for safety. Moreover, the stress factor used as the goal’s LoF showed that the intensity of emotions is greater according to the probability of an accident. Thus, the SF can be used as the LoF. Then, we can conclude that this approach generates a situation awareness of the vehicle for dangerous situations.
The stress factor personalizing results shows promising results too. The personalities characteristics depends on the user of the vehicle. Personalizing the stress from the driving style showed that a vehicle can experience significantly different levels of stress depending on the driving style. Furthermore, the personality also affects the emotion computation. This can be a step forward towards personalizing a CarEs.
In future work, strategies to reduce the stress of the system, CarEs should be explored. The strategies should aim to reduce the stress, thus reducing the danger. Hence, the system would compute more positive emotions by making decisions that actually reduces the danger of the passenger, but that are a function of the resilience of a driver, in other words the driving style.
Finally, the scope of this article was limited to the design of the framework and behavioral testing. Then as future work user testing is consider to understand the acceptance of drivers, pedestrian or road users.
Conflict of Interest
All authors declare that they have no conflicts of interest.
Authors Contribution
D.A.M.N. conceived the study conceptualization, implemented the system, designed & implemented the testing and wrote (review & editing) the manuscript; I.B. supervised the project, investigated the state-of-the-art and wrote (review & editing) the manuscript; S.C. wrote the CarE summary (editing) and provided technical support for the new system implementation.
Funding
The authors declare no funding was obtained for this study.
Data Availability
The data that support the findings of this study are available from the corresponding authors, D.A.M.N. or I.B. upon reasonable request.
REFERENCES
Cite This Article
TY  - JOUR
AU  - David A. Manrique Negrin
AU  - Ion Barosan
AU  - Sudhanshu Chouhan
PY  - 2022
DA  - 2022/11/14
TI  - CarEs: An Emotional Model of a Car With the Stress Factor
JO  - Journal of Software Engineering for Autonomous Systems
SP  - 3
EP  - 16
VL  - 1
IS  - 1-2
SN  - 2949-9372
UR  - https://doi.org/10.55060/j.jseas.221114.001
DO  - https://doi.org/10.55060/j.jseas.221114.001
ID  - ManriqueNegrin 2022
ER  -


